Index of Industrial Production: Components, Core Sectors & Weights
The Index of Industrial Production tracks changes in industrial output. See its mining, manufacturing and electricity components and core industries link.
Oct, 2026
•11 min read

Overview
The Index of Industrial Production (IIP) is India's premier high-frequency volume indicator. Compiled monthly by the National Statistical Office (NSO) using a 2011-12 base year, it tracks short-term quantitative changes across mining, manufacturing, and electricity output without the price distortions found in value-added metrics.
Accounting for production dynamics across 407 item groups, the index allocates over 77% of its weight to manufacturing. It also draws over 40% of its total basket from the Eight Core Industries.
Understanding the index requires distinguishing its pure physical volume measurement from value-added national accounts like Gross Domestic Product (GDP). Structural delays in base-year revisions and an inherent reliance on organised factory reporting make the indicator an essential, yet partial, lens on India's evolving industrial landscape.
Why Industrial Output Numbers Dominate Economic Headlines
The Reserve Bank of India and national economic planners monitor industrial output monthly. Factory activity provides the fastest reliable assessment of real economic momentum.
As of early 2025, macroeconomic evaluations rely on high-frequency indicators to bridge the substantial time gap between quarterly national income estimates and daily policy implementation. Industrial production forms the foundational pulse for supply-side economic health. Swings in factory output indicate shifts in capital investment, consumer demand across rural and urban markets, and trade performance well before corporate balance sheets and quarterly GDP figures are finalised.
Policy institutions track these monthly movements to evaluate productive capacity:
- Capacity utilisation checks: Sustained factory expansion signals strong capacity use, encouraging commercial credit deployment.
- Monetary policy inputs: Output trajectories directly inform decisions on benchmark interest rates by signaling underlying economic momentum.
What Is the Index of Industrial Production (IIP)?
The National Statistical Office (NSO) under the Ministry of Statistics and Programme Implementation compiles and releases the all-India Index of Industrial Production as a composite macroeconomic indicator. According to the Ministry of Statistics and Programme Implementation (MoSPI), the index measures short-term volume changes in industrial output relative to a fixed baseline period.
Statistical authorities release the data on the 12th of every month, or the previous working day if the 12th falls on a holiday, maintaining a standard six-week time lag. The current base year 2011-12 took effect in May 2017, replacing the older 2004-05 series to align with updated macroeconomic accounting standards.
Physical volume forms the entire basis of the measurement basket. The 2011-12 series tracks 839 individual items aggregated into 407 item groups, tracking actual quantities produced—such as tonnes of steel, metres of fabric, or units of machinery—rather than nominal financial turnover.
Unlike broad national accounts, the index maintains a strict industrial boundary:
- Included sectors: Mining, Manufacturing, and Electricity generation.
- Excluded sectors: Agriculture and services are excluded, restricting the scope exclusively to physical industrial output.
Discuss with Superkalam
Which specific industry holds the single highest weight within the Eight Core Industries basket?
Ask NowTwo Ways to Break Down IIP: Sectoral vs Use-Based Classification
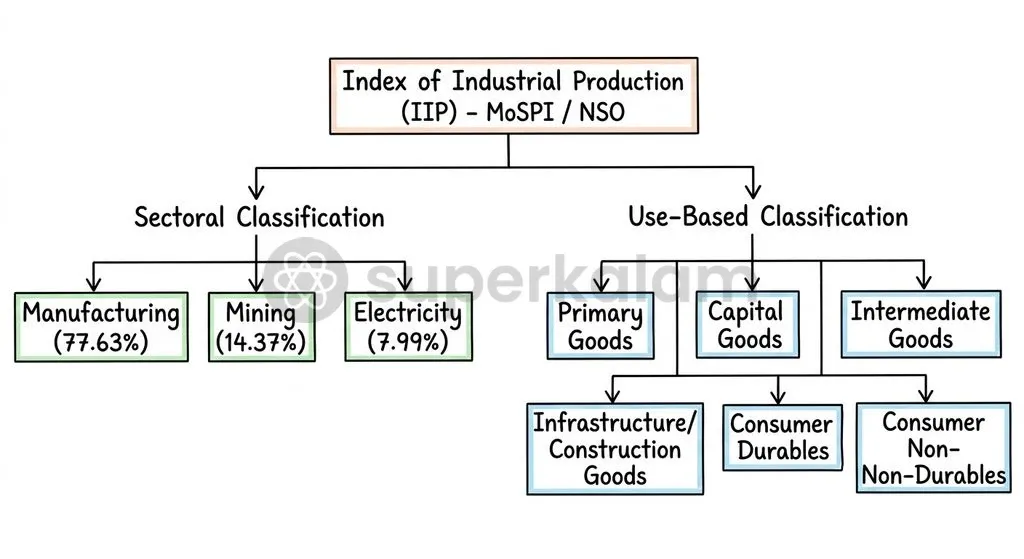
The Ministry of Statistics and Programme Implementation classifies industrial production data into two parallel frameworks: a supply-side sectoral breakdown and an end-use functional classification. Both structures share the identical data universe and baseline weight of 100%, but arrange the underlying items to serve different analytical needs.
Sectoral classification divides output by broad industry domains. Under this breakdown, Manufacturing forms the dominant pillar, followed by Mining and Electricity.
Use-based classification categorises items by their final socioeconomic purpose. This approach groups industrial output according to how products enter the economic pipeline, tracking capital creation, raw input processing, and consumer demand.
| Classification Dimension | Category Name | Weight in Index (%) | Analytical Function for Economic Tracking |
|---|---|---|---|
| Sectoral | Manufacturing | 77.63% | Tracks factory transformation activities across 407 item groups |
| Sectoral | Mining | 14.37% | Reflects primary resource extraction from mineral and energy deposits |
| Sectoral | Electricity | 7.99% | Measures total generation volume across thermal, hydro, and nuclear plants |
| Use-Based | Primary Goods | 34.05% | Captures unprocessed basic extraction including ores, fuels, and electricity |
| Use-Based | Intermediate Goods | 17.22% | Tracks semi-finished inputs used directly in downstream manufacturing |
| Use-Based | Consumer Non-durables | 15.33% | Monitors fast-moving daily household essentials and perishable output |
| Use-Based | Consumer Durables | 12.84% | Measures long-lasting household assets, indicating discretionary spending |
| Use-Based | Infrastructure / Construction | 12.34% | Tracks physical building inputs like cement, structural steel, and fixtures |
| Use-Based | Capital Goods | 8.22% | Reflects plant machinery and transport equipment driving fixed investment |
Weights based on the 2011-12 series.
Primary Goods command the single largest share within the use-based breakdown. Meanwhile, Capital Goods, despite carrying the smallest weight at 8.22%, is a direct barometer of private corporate investment and productive expansion across the economy.
Discuss with Superkalam
Explain why Capital Goods output is considered a lead indicator for private corporate investment.
Ask NowThe Eight Core Industries: How They Drive IIP and Their Weightage Hierarchy
The Office of the Economic Adviser under the Department for Promotion of Industry and Internal Trade compiles the Index of Eight Core Industries as a key lead indicator. This specialised sub-index tracks the monthly output of eight foundational infrastructure and energy sectors, as reported by the Ministry of Commerce and Industry.
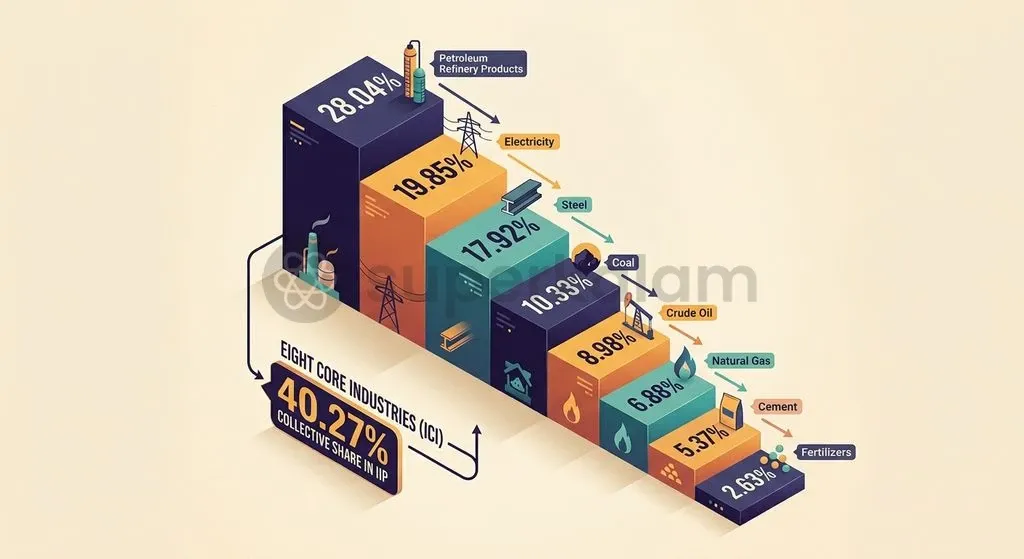
Core industries account for a combined weight of 40.27% in the broader production index. Because these industries produce primary inputs that feed into hundreds of downstream factory processes, their performance acts as an early indicator for overall manufacturing momentum.
Statistical authorities publish the core index approximately 12 days ahead of the full index, giving policymakers a preview of broad industrial performance.
Within the core basket, Petroleum Refinery Products carries the highest weight, whereas Fertilizers carries the lowest weight. Remembering this hierarchy is essential for civil services examinations:
- Petroleum Refinery Products (28.04%)
- Electricity (19.85%)
- Steel (17.92%)
- Coal (10.33%)
- Crude Oil (8.98%)
- Natural Gas (6.88%)
- Cement (5.37%)
- Fertilizers (2.63%)
Heavy representation of refinery products, electricity, and steel means that basic energy and construction inputs drive more than 65% of the core indicator's aggregate movements.
Discuss with Superkalam
If global crude oil prices drop sharply while domestic factory output remains stagnant, how would this affect the divergence between IIP and manufacturing GVA?
Ask NowHow IIP Data Shapes Monetary Policy and GDP Estimates
The Reserve Bank of India utilises monthly industrial volume trends to evaluate capacity utilisation and calibrate policy repo rates ahead of quarterly national accounts. Because the Monetary Policy Committee operates on forward-looking inflation and growth projections, high-frequency industrial volumes provide real-time evidence of economic momentum.
Volume trends show whether supply bottlenecks or aggregate demand shifts are driving price pressures. Strong output in Consumer Durables and Capital Goods indicates solid domestic absorption. Conversely, persistent stagnation across manufacturing sub-sectors signals underutilised factory capacity, often supporting an accommodative policy stance.
National income accountants at MoSPI use monthly industrial output to construct preliminary quarterly Gross Value Added (GVA) estimates. As the National Statistical Office notes, the production index is the primary volume indicator used to extrapolate manufacturing GVA before comprehensive enterprise financial filings become available.
The estimation and reconciliation process follows two distinct stages:
- Preliminary GVA benchmark: Extrapolated directly from high-frequency IIP volume metrics.
- Final value-added accounts: Benchmarked against the Annual Survey of Industries with detailed deflation adjustments.
Divergences between industrial output indices and manufacturing GVA frequently emerge because of distinct accounting methodologies. While the industrial index tracks pure quantitative production volumes, GVA measures economic value addition adjusted for input costs, taxes, and operational efficiencies.
A manufacturing firm may experience flat unit volumes while generating higher gross value added by shifting to premium product lines, adopting energy-efficient production methods, or benefiting from lower raw material prices.
Structural Limitations: Informal Economy Blindspots and the Base Year Question
The Technical Advisory Committee of MoSPI has highlighted structural blindspots in industrial measurement, particularly regarding unorganised enterprises and outdated product baskets. These methodological constraints demand careful analytical consideration in civil services evaluations.
Three structural bottlenecks affect the reliability of the current index:
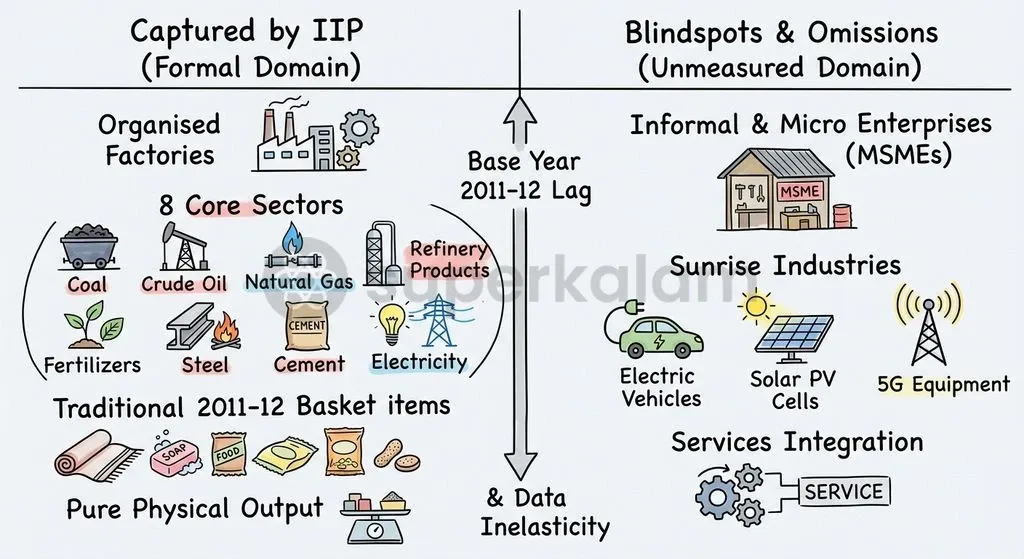
- Formal-sector reporting bias: Primary source data relies heavily on large registered factories from the Annual Survey of Industries (ASI) and administrative ministries, leaving the unorganised and MSME sectors underrepresented. When external shocks impact informal enterprises differently from large corporations, the index can overstate overall industrial resilience.
- Capital goods volatility: The category covers large, specialised machinery, heavy boilers, and customised transport equipment with extended production cycles. When long-gestation machinery is logged upon completion in a single reporting cycle, it produces statistical spikes that distort the broader manufacturing index.
- Outdated base-year weights: A dated 2011-12 base year weakens the index's ability to reflect India's modern industrial structure.
Specific base-year distortions include:
- Sunset goods over-weighted: Legacy items like CRT television tubes and older internal combustion vehicle components retain historical weight allocations.
- Sunrise sectors omitted or under-weighted: Modern growth drivers like solar photovoltaic modules, electric vehicle platforms, and advanced consumer electronics are absent or under-represented.
Discuss with Superkalam
Compare the analytical utility of the Core Industries Index published by DPIIT versus the full IIP released by NSO for macroeconomic policymakers.
Ask NowFrequent UPSC Traps: Tricky Distinctions Aspirants Often Miss
Civil services candidates frequently confuse compiling agencies, volume versus value metrics, and the conceptual boundaries separating core inflation from core industries. Mastering these technical nuances prevents common errors across Prelims and Mains.
The difference between compiling authorities represents a classic examination trap. The National Statistical Office under MoSPI publishes the broad production index, while the Office of the Economic Adviser within DPIIT under the Ministry of Commerce and Industry compiles the Index of Eight Core Industries.
| Conceptual Dimension | What Candidates Often Assume | The Exam-Accurate Reality | Source Anchor |
|---|---|---|---|
| Compiling Authority | MoSPI compiles both the overall IIP and the Eight Core Industries. | NSO (MoSPI) compiles IIP; the Office of Economic Adviser (DPIIT, Commerce Ministry) compiles Core Industries. | |
| Measurement Unit | IIP tracks financial turnover or industrial value addition. | IIP is a pure physical volume index measuring quantitative units produced, not monetary value. | |
| Economic Coverage | IIP reflects total secondary sector activity, including construction. | IIP covers only Mining, Manufacturing, and Electricity; it excludes Construction, Agriculture, and Services. | |
| "Core" Definition | Core inflation and Core Industries track the same economic sectors. | Core inflation excludes food and energy/fuel; Eight Core Industries is heavily energy- and fuel-dominated. | |
| Weights Hierarchy | Steel or Electricity holds the highest weight in Core Industries. | Petroleum Refinery Products ranks highest (28.04%), while Fertilizers ranks lowest (2.63%). |
Aspirants must also distinguish core concepts in inflation from those in industrial production. Headline CPI inflation stripped of food and energy yields core inflation, yet energy and fuel categories account for over half of the weight in the Eight Core Industries index.
The Road Ahead: Modernising India's High-Frequency Industrial Metrics
Modernising statistical frameworks requires the National Statistical Office to accelerate base-year recalibrations and integrate emerging manufacturing ecosystems into high-frequency tracking. Updating the industrial series to a more recent base year is essential to capture shifts driven by production-linked incentive schemes and clean-energy supply chains.
The Technical Advisory Committee has recommended updating item baskets to include solar photovoltaic modules, electric vehicles, and advanced electronics assembly. Incorporating these items will prevent outdated weight allocations from skewing overall manufacturing estimates.
Harnessing digital regulatory data can also help bridge the informal-sector data gap. Integrating Goods and Services Tax Network (GSTN) transaction trends, e-way bill volumes, and corporate digital compliance filings alongside factory-floor counts will give policymakers a more accurate, timely view of India's dual industrial economy.
Key Takeaways
- The National Statistical Office (NSO) under MoSPI releases the Index of Industrial Production monthly on the 12th with a standard six-week lag using a 2011-12 base year.
- Sectoral classification allocates 77.63% to Manufacturing, 14.37% to Mining, and 7.99% to Electricity across 407 item groups.
- Use-based classification assigns the largest share to Primary Goods (34.05%) and the smallest to Capital Goods (8.22%), which serves as an indicator of corporate fixed investment.
- The Eight Core Industries account for 40.27% of IIP weight and are compiled separately by the Office of the Economic Adviser in DPIIT under the Ministry of Commerce and Industry.
- The weightage hierarchy among the Eight Core Industries runs from Petroleum Refinery Products (28.04%) at the top to Fertilizers (2.63%) at the bottom.
- Structural limitations include a formal-sector reporting bias, capital goods order volatility, and a dated 2011-12 base year that under-weights modern sunrise sectors like renewable energy and electric vehicles.
Mains Question
"The Index of Industrial Production serves as a critical pulse for monetary policy and national income accounting, yet structural divergences often emerge between IIP growth and manufacturing Gross Value Added (GVA)." Elucidate. (150 words) (10 Marks)
Evaluate NowMains Question
Critically examine the institutional design and structural limitations of India's Index of Industrial Production (IIP) in capturing the contemporary reality of the industrial sector. (250 words) (15 Marks)
Evaluate NowPractice MCQs
QUESTION 1
With reference to the Index of Industrial Production (IIP) in India, consider the following statements:
- It is compiled and released monthly by the National Statistical Office (NSO) under the Ministry of Statistics and Programme Implementation.
- The index measures both physical production volume and price-adjusted value addition across industrial and service sectors.
- In the sectoral classification of IIP, Manufacturing commands more than 75% of the total weight.
Which of the statements given above are correct?
QUESTION 2
With reference to the Use-Based Classification of the Index of Industrial Production (2011-12 series), consider the following statements:
- Primary Goods hold the largest single weight among all use-based categories.
- Capital Goods carry a higher weight in the index than Consumer Durables.
- Infrastructure and Construction goods include physical inputs such as cement and structural steel.
Which of the statements given above is/are correct?
QUESTION 3
Consider the following statements regarding the Index of Eight Core Industries:
- It is compiled by the Office of the Economic Adviser under the Department for Promotion of Industry and Internal Trade.
- The eight core industries collectively constitute over 40% of the weight of items included in the Index of Industrial Production.
- Within the core basket, Electricity carries the highest weight, whereas Fertilizers carries the lowest weight.
Which of the statements given above is/are correct?
QUESTION 4
Which of the following represents the correct descending order of the Eight Core Industries in terms of their weightage in the Index of Industrial Production?
QUESTION 5
With reference to industrial output metrics in India, consider the following statements:
- The Index of Eight Core Industries is published roughly 12 days prior to the release of the complete IIP data.
- IIP volume figures are used by statistical authorities to construct preliminary Gross Value Added (GVA) estimates for manufacturing.
- Discrepancies between IIP and manufacturing GVA growth occur because GVA accounts for input efficiencies and value additions, unlike volume-based IIP.
Which of the statements given above are correct?