Index of Core Industries: Nine Sectors and Base Year 2022-23
Rebasing India's industrial backbone corrects fossil-fuel distortions and realigns core factory signals with an electrifying economy.
Oct, 2026
•9 min read
Context
India's traditional Index of Eight Core Industries anchored over forty percent of the Index of Industrial Production, but its reliance on an outdated 2011-12 base year and heavy fossil-fuel concentration created a structural blind spot that distorted high-frequency signals of modern industrial performance. This mismatch meant that rapid electrification and decentralised commercial clean energy were poorly captured, while global hydrocarbon volatility exerted an outsized influence on domestic manufacturing projections. To address these structural distortions, the government revamped the framework by rebasing the series to 2022-23 and expanding the basket to nine industries. This reform recalibrates statistical measurement to provide a more accurate diagnostic tool for modern macroeconomic policymaking.
Why in the News: Monthly Releases and the Base Year Overhaul
As of October 2026, India's high-frequency industrial monitoring operates under a fundamentally restructured framework. On July 20, 2026, the Office of the Economic Adviser formally rolled out the revised Index of Core Industries series with base year 2022-23=100. This statistical overhaul replaced the 2011-12 series, expanding coverage from eight to nine core industries through the inclusion of Iron Ore.
The structural transition has already yielded notable shifts in output metrics. According to a release by the Ministry of Commerce and Industry, the provisional Index of Core Industries for September 2026 recorded a year-on-year growth rate of 7.9 percent, marking a 30-month high. This acceleration was driven primarily by Iron Ore at 18.4 percent, Electricity at 11.4 percent, and Coal at 10.7 percent, even as Natural Gas, Fertilizers, and Crude Oil contracted.
Cumulatively, the April to September 2026-27 core output expanded by 5.1 percent provisional under the 2022-23 base. This compares favourably to the 2.5 percent growth rate recorded across the corresponding period of the previous year.
Discuss with Superkalam
Which industrial sector holds the highest individual weight in the revised 2022-23 Index of Core Industries basket?
Ask NowWhat Are the Core Industries? The Changing Backbone of Growth
The Index of Core Industries measures the collective volume output of basic infrastructure and input sectors across the Indian economy. Compiled and published monthly by the Office of the Economic Adviser (OEA) within the Department for Promotion of Industry and Internal Trade (DPIIT), the index tracks key physical commodities before secondary manufacturing aggregates them. Historically, the basket evolved over time; it expanded from six sectors to eight during the 2004-05 base revision by adding Fertilizers and Natural Gas.
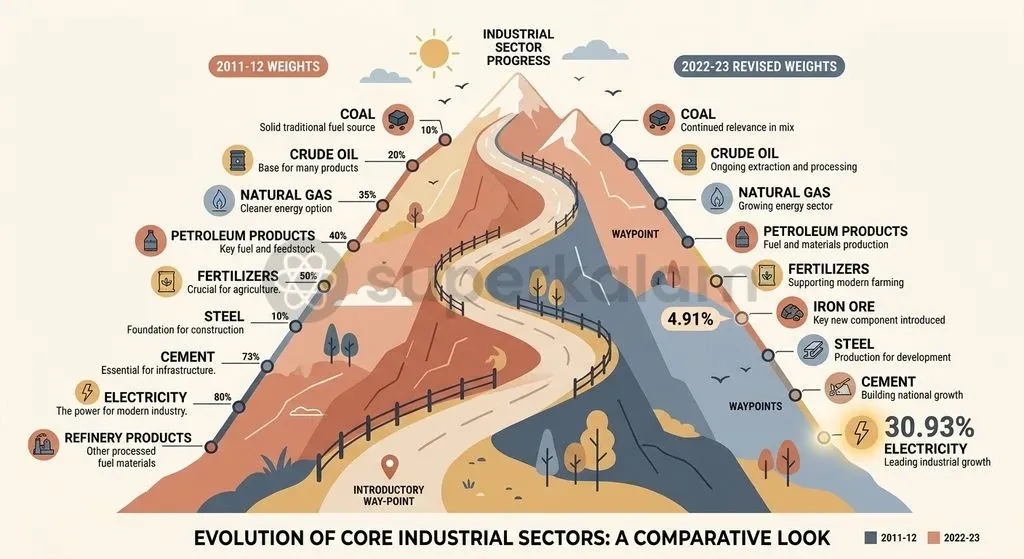
Under the 2011-12 base year, the Eight Core Industries comprised 40.27 percent of the total item weight in the broader Index of Industrial Production (IIP). Under the revised 2022-23 series, the combined weight of the core industries in the IIP was revised downward to 32.88 percent. Furthermore, the internal sector weights redistributed out of 100 shifted drastically. Electricity superseded Petroleum Refinery Products as the largest individual driver within the core basket.
| Sector | Weight in 2011-12 Series (%) | Weight in Revised 2022-23 Series (%) | Primary Shift / Methodological Adjustment |
|---|---|---|---|
| Electricity | 19.85 | 30.93 | Elevated to highest weight; expanded renewable tracking |
| Petroleum Refinery Products | 28.04 | 22.57 | Reduced weight; reflects broadening industrial base |
| Steel | 17.92 | 17.58 | Switched from net production to gross production |
| Crude Oil | 8.98 | 7.43 | Decreased relative share due to stagnating domestic extraction |
| Coal | 10.33 | 5.60 | Excluded coal middlings and washed coal to avoid double counting |
| Iron Ore | Not Included (0.00) | 4.91 | Newly inducted ninth core sector |
| Cement | 5.37 | 4.41 | Marginal weight recalibration |
| Natural Gas | 6.88 | 3.84 | Reduced share in domestic upstream fuel mix |
| Fertilizers | 2.63 | 2.73 | Remains lowest individual weight in the core basket |
| Total | 100.00 | 100.00 | 40.27% of IIP (2011-12) vs 32.88% of IIP (2022-23) |
How the Core Index Predicts the Broader Index of Industrial Production
The core sector functions as an indispensable high-frequency lead indicator because basic capital and energy goods precede final consumer manufacturing. Under the traditional operational calendar, the core index was released with a one-month time lag on the last working day of the following month. This published data arrived approximately 12 days prior to the release of the general IIP, giving policymakers an early window into factory output trends.
Under the revised 2022-23 base schedule, the OEA streamlined this timeline further. The provisional index for a reference month is now published on the 20th of the following month, compressing the publication lag and equipping macroeconomic planners with faster diagnostic inputs. When calculating continuity between the series, statisticians compute a linking factor. The linking factor between the 2011-12 series and the 2022-23 series relies on the ratio of the geometric mean of the monthly indices of the old series to that of the new series for the base year 2022-23.
Discuss with Superkalam
Why does a decline in utility-dispatched electricity generation not necessarily indicate a slump in actual industrial manufacturing activity?
Ask NowThe Missing Green Surge: Why Captive Renewables Escape the Electricity Basket
A central analytical criticism of the legacy 2011-12 core series was its inability to mirror India's structural energy transition. Although generation from renewable sources was formally integrated into the Central Electricity Authority (CEA) tracking framework from April 2014, significant blind spots persisted.
The primary structural distortion stemmed from data collection limitations:
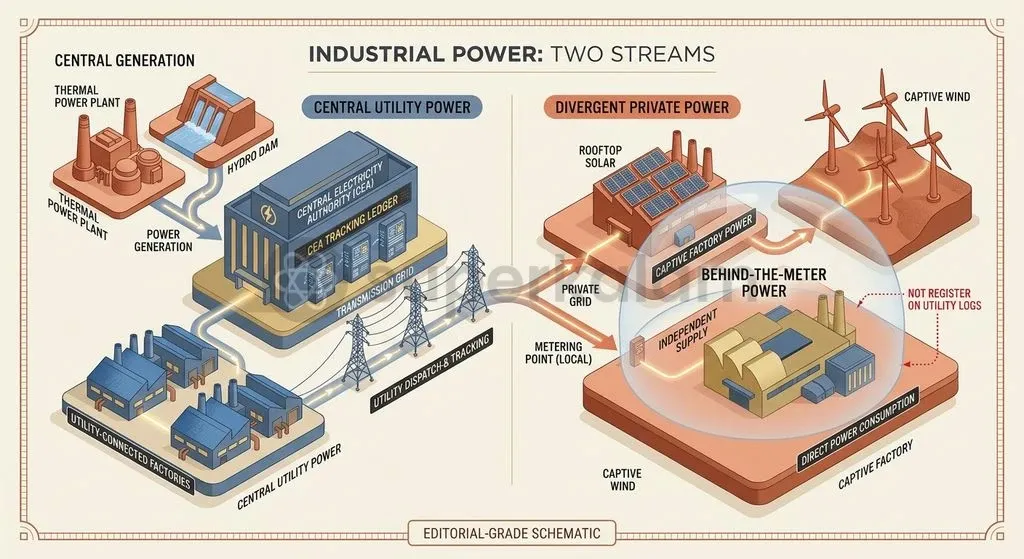
- The electricity sub-index predominantly tracked grid-connected utility generation from major thermal, hydro, and central renewable plants.
- It systematically bypassed behind-the-meter captive industrial solar units installed directly by commercial manufacturing facilities.
- It omitted decentralised commercial rooftop installations, understating actual industrial power consumption.
Because commercial consumers increasingly bypass the grid via captive solar and wind parks, a slowdown in utility grid dispatches did not automatically signify slumping manufacturing demand. The legacy core index risked registering false negatives in power demand, misreading industrial decentralisation as an economic contraction.
The 2011-12 Base Year Dilemma: What the Pronab Sen Working Group Found
The push to replace the 2011-12 macroeconomic baseline emerged from institutional reviews of India's statistical architecture. Expert committees on macroeconomic statistics, including working groups involving former Chief Statistician Pronab Sen and the Standing Committee on Statistics (SCoS), consistently recommended revising macroeconomic base years every five years. A prolonged base year produces structural obsolescence, failing to reflect modern digitisation, shifts in consumer baskets, and changing capital goods dynamics.
Retaining the 2011-12 base for over a decade created three significant methodological distortions:
- Product Misclassification: Emerging modern inputs used in advanced fabrication were entirely missing from raw industrial production surveys.
- Double Counting in Mining: In the coal sector compilation, secondary derivatives like Coal Middlings and Washed Coal were previously counted alongside extracted raw supply, inflating output volume figures.
- Mismatched Production Metrics: In steel, output was historically recorded as net production, which created reconciliation disparities against the general IIP framework.
The 2022-23 revision directly resolved these structural anomalies. In coal compilation, Coal Middlings and Washed Coal were eliminated from the index basket, retaining strictly Raw Coal to eliminate double counting. Simultaneously, steel computation transitioned from net production to gross production, ensuring structural symmetry between the core index and IIP releases.
Discuss with Superkalam
If a global oil disruption halts domestic refinery operations for a month, how would the revised 2022-23 weights dampen misleading volatility compared to the 2011-12 series?
Ask NowLegacy Smoke-Stacks vs New Reality: Weighing the Push to Reshuffle Core Sectors
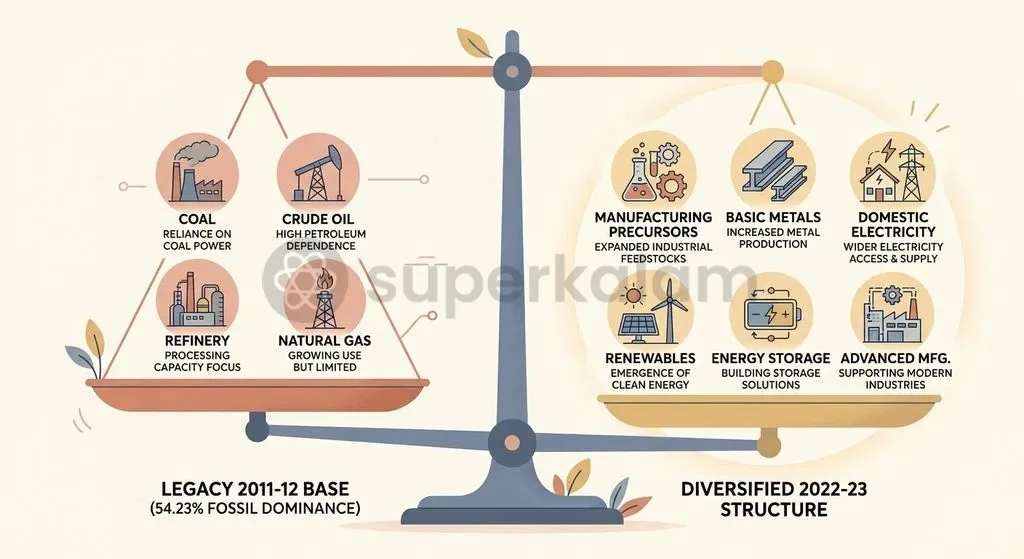
The analytical debate surrounding the core index has long centered on the tension between legacy heavy industry and emerging technological drivers. In the 2011-12 series, four fossil fuel-linked sectors—Petroleum Refinery Products (28.04%), Coal (10.33%), Crude Oil (8.98%), and Natural Gas (6.88%)—commanded 54.23 percent of the entire core index basket. Consequently, the indicator frequently behaved as an energy index rather than a true proxy for broader manufacturing vitality.
A heavy hydrocarbon concentration penalised the index during periods of volatile global trade. If refinery throughput fell due to seasonal overseas maintenance or pipeline shifts, the entire core index decelerated, masking robust domestic assembly lines in engineering, electronics, or automotive sectors.
The induction of Iron Ore at a 4.91 percent weight and the elevation of Electricity to 30.93 percent represent vital first steps toward modernising this tracking architecture. By reducing the cumulative weight of primary fossil fuels, the revised index decouples headline industrial estimates from crude price shocks, tying factory output signals more tightly to physical capital generation.
Way Forward: Building a Core Index That Reflects a Decarbonized Economy
Revising the base year to 2022-23 fixes long-standing technical distortions, but maintaining statistical accuracy requires continuous institutional adaptation. As India's industrial sector undergoes deep decarbonisation and digital transformation, statistical frameworks must evolve faster than the traditional ten-year revision cycle.
To ensure high-frequency indicators remain reliable guides for policy, statistical agencies should prioritize three structural reforms:
- Institutionalise Five-Year Rebasing: Implement the Pronab Sen working group recommendations by establishing a predictable five-year revision cadence for IIP, Core Industries, and national accounts.
- Capture Decentralised Power Generation: Integrate smart meter telemetry and state distribution utility feed-in data into Central Electricity Authority compilations to track commercial rooftop and captive renewable power.
- Incorporate Advanced Value-Chain Inputs: Evaluate high-growth industrial precursors, such as aluminium, copper, and basic electronic components, for future core sector expansions to reflect modern manufacturing supply chains.
A resilient, representative core index ensures that capital allocation, reserve management, and monetary policy decisions are guided by data that mirrors India's evolving green economy.
Discuss with Superkalam
Compare how shifting steel reporting from net to gross production and eliminating coal middlings alters the structural consistency between the core index and the general IIP.
Ask NowKey Takeaways
- The revised Index of Core Industries adopted the 2022-23=100 base year on July 20, 2026, replacing the outdated 2011-12 series.
- The core basket expanded from eight to nine industries by inducting Iron Ore with a 4.91 percent weight.
- Combined core industry weighting within the broader Index of Industrial Production (IIP) was revised downward from 40.27 percent to 32.88 percent.
- Under the 2022-23 base series, Electricity holds the highest internal weight at 30.93 percent, replacing Petroleum Refinery Products (22.57 percent).
- Methodological cleanups eliminated Coal Middlings and Washed Coal to prevent double counting, and shifted steel assessment to gross production.
- High-frequency provisional releases now publish on the 20th of the following month, improving lead-indicator timing ahead of the general IIP.
Mains Question
A prolonged retention of macroeconomic base years produces structural obsolescence in high-frequency statistical indicators. In light of the recommendations of the Pronab Sen working group, examine the structural and methodological distortions addressed by rebasing the Index of Core Industries to 2022-23. (10 Marks)
Evaluate NowMains Question
'The excessive concentration of fossil fuels in the legacy Index of Eight Core Industries compromised its reliability as a proxy for broad-based industrial vitality.' Critically analyse this assertion, and evaluate how the revised 2022-23 basket addresses structural imbalances in the Indian economy. (15 Marks)
Evaluate NowPractice MCQs
QUESTION 1
With reference to the revised Index of Core Industries (Base Year 2022-23), consider the following statements:
- Iron Ore was inducted as the ninth sector in the core industries basket.
- The collective weight of the core industries in the Index of Industrial Production (IIP) was revised downward from 40.27 percent to 32.88 percent.
- Electricity superseded Petroleum Refinery Products as the individual component with the highest weight in the basket. Which of the statements given above are correct?
QUESTION 2
Regarding the methodological adjustments introduced in the 2022-23 Index of Core Industries series, consider the following statements:
- Secondary coal derivatives such as coal middlings and washed coal were eliminated to prevent double counting.
- The calculation of steel output was transitioned from net production to gross production to ensure consistency with the IIP framework.
- The publication timeline of the provisional core index was compressed, releasing data on the 20th of the following month. Which of the statements given above is/are correct?
QUESTION 3
Consider the following statements regarding the tracking of electricity in India's Index of Core Industries:
- Generation from renewable energy sources was formally integrated into the Central Electricity Authority (CEA) tracking framework from April 2014.
- The legacy 2011-12 index adequately captured industrial electricity demand by fully accounting for behind-the-meter captive solar installations.
- The linking factor between the 2011-12 series and the 2022-23 series is computed using the ratio of the geometric mean of monthly indices of the old series to the new series for 2022-23. Which of the statements given above is/are correct?
QUESTION 4
With reference to the institutional framework of the Index of Core Industries in India, consider the following statements:
- The index is compiled and released monthly by the Office of the Economic Adviser within the Department for Promotion of Industry and Internal Trade (DPIIT).
- Fertilizers and Natural Gas were introduced into the core basket during the 2004-05 base revision.
- Fertilizers commands the lowest individual weight among all nine core sectors in the revised 2022-23 series. Which of the statements given above are correct?
QUESTION 5
The Index of Core Industries serves as a key high-frequency lead indicator for the broader Index of Industrial Production (IIP) primarily because: