Eight Core Industries Surge 10.9%: Decoding the Private Capex Paradox
Record infrastructure spending has ignited heavy industry, but factory utilization must cross 75% to unlock the private investment India actually needs.
Nov, 2026
•9 min read

Overview
India's Index of Eight Core Industries expanded by 10.9% year-on-year in October 2026. This accelerated from an upwardly revised 8.2% in September 2026.
The rebound demonstrates strong state-directed infrastructure construction. Yet it exposes a persistent structural divergence from broader industrial momentum across the wider economy.
Heavy public budgetary outlays have stimulated upstream production in civil works inputs. Meanwhile, private corporate capital expenditure continues to lag across domestic manufacturing sectors. High state investment cannot indefinitely substitute for private capital spending, especially as fiscal consolidation targets constrain future budget growth.
Why in the News? Making Sense of the 10.9% Core Sector Rebound
A sharp production rebound masked underlying divergence across sectors.
The Ministry of Commerce and Industry reported that the Index of Eight Core Industries grew by 10.9% year-on-year in October 2026. This double-digit expansion followed an upwardly revised growth rate of 8.2% recorded in September 2026, according to provisional figures from the Office of the Economic Adviser. The rebound reflects significant domestic industrial activity heading into the second half of the fiscal year.
A favourable baseline significantly boosted this headline acceleration. Core industrial output expanded by only 0.8% in October 2025, according to the Ministry of Commerce and Industry. That suppressed base created an arithmetic tailwind for the October 2026 surge.
Cumulative expansion in the core index between April and October 2026 reached 6.0%, compared with 2.3% over the corresponding period in 2025. Extractive and infrastructure-linked segments drove most of this output:
- Iron Ore: Output surged by 26.4% year-on-year, marking the fastest expansion among all tracked components.
- Coal: Production climbed by 23.1%, supported by elevated seasonal demand from thermal generating stations.
- Laggards: Crude oil, natural gas, and fertilisers contracted during October 2026, revealing that recovery was uneven across heavy industries.
Discuss with Superkalam
Which individual core industry carries the highest weight within the Index of Eight Core Industries?
Ask NowBeyond the Weightages: How the Eight Core Industries Drive Industrial Growth
Core infrastructure inputs dictate the pace of downstream Indian manufacturing.
The Index of Eight Core Industries tracks foundational materials that support wider production across the Indian economy. Published monthly by the Office of the Economic Adviser within the Department for Promotion of Industry and Internal Trade, the index uses 2011-12 as its base year.
These eight segments carry a combined weight of 40.27% within the broader Index of Industrial Production. Shifts in these core sectors signal future operational turns for downstream manufacturing and consumer supply chains.
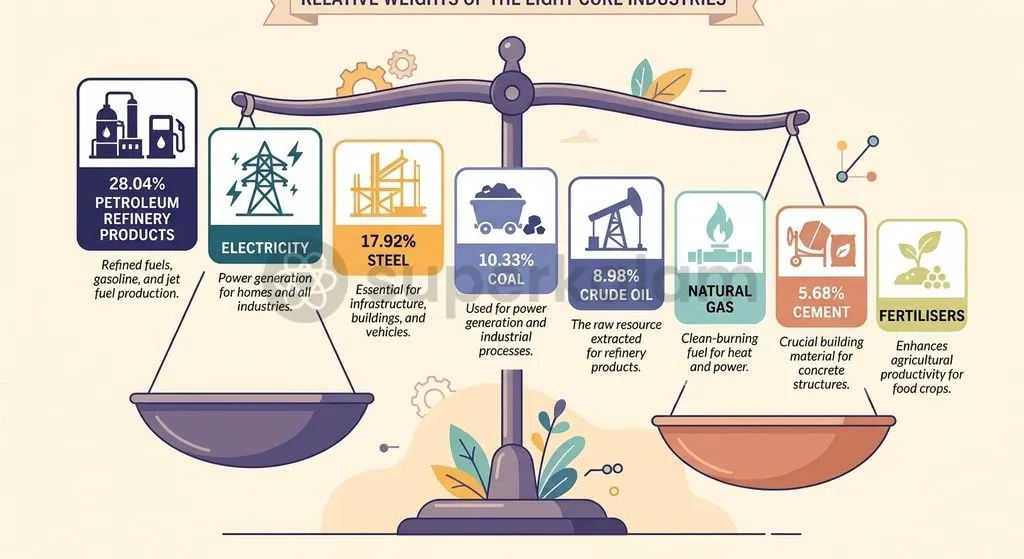
Petroleum refinery products command the largest single weight inside the composite index, followed closely by electricity and basic metals. When energy production and construction inputs surge, factory output typically accelerates over subsequent quarters.
| Core Industry | Weight in Core Index (%) | Weight in IIP (%) | Primary Macroeconomic Driver |
|---|---|---|---|
| :--- | :--- | :--- | :--- |
| Petroleum Refinery Products | 28.04% | 11.29% | Commercial mobility, industrial logistics, petrochemical feedstocks |
| Electricity Generation | 19.85% | 7.99% | Base-load industrial manufacturing, urban domestic load, irrigation pumping |
| Steel Production | 17.92% | 7.22% | National highways, urban mass-transit networks, heavy engineering |
| Coal Production | 10.33% | 4.16% | Thermal power generation, domestic metallurgical processing |
| Crude Oil | 8.98% | 2.77% | Upstream energy security, refinery domestic feed intake |
| Natural Gas | 6.88% | 3.62% | City gas networks, power plants, industrial feedstock |
| Cement | 5.37% | 2.16% | Public infrastructure projects, commercial housing, real estate |
| Fertilisers | 2.63% | 1.06% | Agricultural soil nutrient demand, cropping seasons |
The performance breakdown for October 2026 shows stark divergence across these weighted categories. Refinery products rose by only 3.4% year-on-year, decelerating noticeably from an 8.7% growth rate achieved in September 2026.
By contrast, electricity generation expanded by 21.6%, providing the largest weighted contribution to the overall composite acceleration. Cement output grew by 15.4%, while domestic steel production expanded by 7.3%.
Where the Momentum Came From: The Heavy Hand of State-Led Capital Spending
Direct budgetary outlays from New Delhi provided the foundation for output growth.
Central capital outlays anchored the entire early-winter industrial turnaround. The central government has systematically expanded its capital spending to modernise national freight infrastructure and support domestic industrial capacity.
The Union Budget allocated ₹11.21 lakh crore for central capital expenditure in FY 2025-26, representing 3.1% of national gross domestic product. The Ministry of Finance expanded this gross capital allocation to ₹12.2 lakh crore for FY 2026-27 to prevent project slowdowns.
State-level capital formation received direct funding through targeted fiscal lending channels:
- Sub-National Loans: The Centre allocated ₹1.5 lakh crore through the Scheme for Special Assistance to States for Capital Investment, delivering 50-year interest-free loans for regional logistics corridors and civil works.
- Input Demand: Public capital spending in heavy transit corridors crowds in targeted demand for structural metals and machinery, according to a working paper from the National Institute of Public Finance and Policy.
- Logistics Efficiency: National logistics costs dropped to between 7.97% and 8.5% of GDP, down from historical double-digit figures, per the Department for Promotion of Industry and Internal Trade.
Discuss with Superkalam
Why does a prolonged operating capacity utilisation rate below 75% discourage corporate boards from pursuing greenfield investments?
Ask NowThe Central Paradox: Why Record Public Capex Has Not Triggered Private Investment
Balance sheets are clean, yet private factory investment remains stagnant.
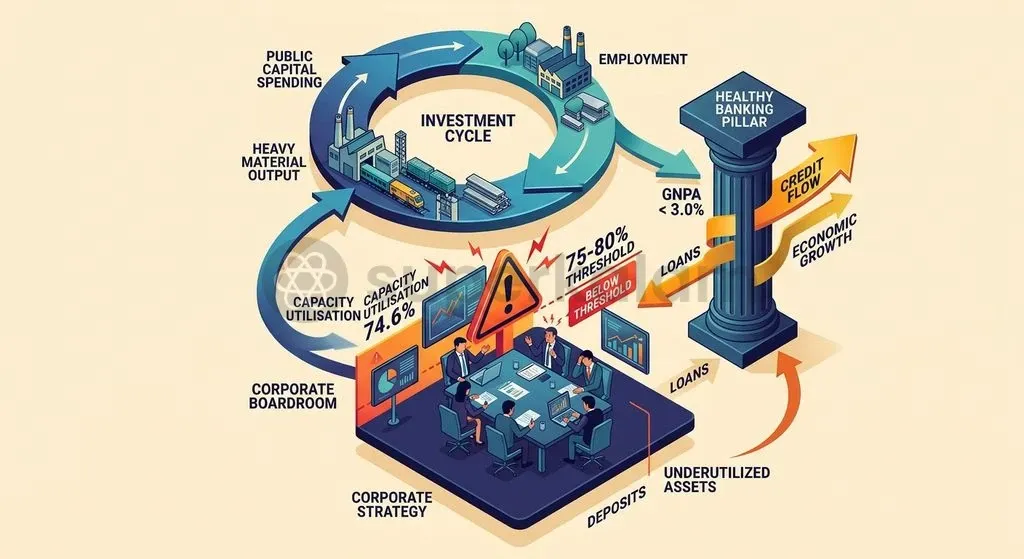
Corporate capital spending has remained cautious despite record public investment and clean private balance sheets. Macroeconomic theory holds that heavy public capital investment crowds in private investment by building out connectivity and lowering transport logistics costs. In India, private capital expenditure has expanded primarily within isolated, capital-intensive segments rather than across broad manufacturing.
Commercial lending conditions remain exceptionally favourable for corporate borrowing. Gross non-performing assets across scheduled commercial banks dropped below 3.0%, as reported by the Reserve Bank of India in its Financial Stability Report. This eliminated banking balance-sheet distress as an investment hurdle.
| Macro Lever | Current Status | Investment Transmission Obstacle |
|---|---|---|
| :--- | :--- | :--- |
| Public Capital Capex | Elevated at ₹12.2 lakh crore (FY 2026-27) | Confined mainly to upstream civil inputs |
| Logistics Overhead | Reduced to 7.97%–8.5% of GDP | Fails to spur downstream consumer demand |
| Bank Balance Sheets | Clean (GNPA below 3.0%) | Corporates avoiding greenfield credit |
| Capacity Trigger | Operating at 74.6% (Q1:2026-27) | Sits below the 75%–80% investment threshold |
| Mass Consumption | Subdued real rural wages | Disincentivises capacity expansion |
Corporate entities have largely avoided taking on fresh debt to fund greenfield expansion projects. As reported by forward-looking surveys from the Ministry of Statistics and Programme Implementation, internal corporate accruals likely funded over 65% of aggregate private capital spending in 2025-26.
The Economic Survey noted that private sector investment remains concentrated in data centres and renewables, telecom networks, and metal smelting. Traditional labour-intensive sectors, such as textile manufacturing and basic consumer goods, have largely deferred substantial expansion plans.
Discuss with Superkalam
How does subdued rural real wage growth counteract the crowd-in effects expected from large-scale government infrastructure spending?
Ask NowThe Consumption Bottleneck: Why Weak Demand Keeps Factory Utilization Below the Line
Factory managers will not build new capacity while existing machinery sits idle.
Manufacturing firms avoid building new production facilities when current plant output remains below targeted operating thresholds. Factory investment decisions hinge on three distinct operating dynamics:
- Sub-Threshold Utilisation: Manufacturing capacity utilisation stood at 74.6% in the first quarter of FY 2026-27, according to the Reserve Bank of India's Order Books, Inventories and Capacity Utilisation Survey. Seasonally adjusted capacity registered at 76.3% over the same operational cycle.
- The Capex Trigger: Empirical benchmarks published by the Reserve Bank of India indicate that aggregate plant utilisation must sustain between 75% and 80% to spur broad greenfield investments. Until production crosses this threshold, corporate boards prefer optimising existing assembly lines rather than deploying capital on new facilities.
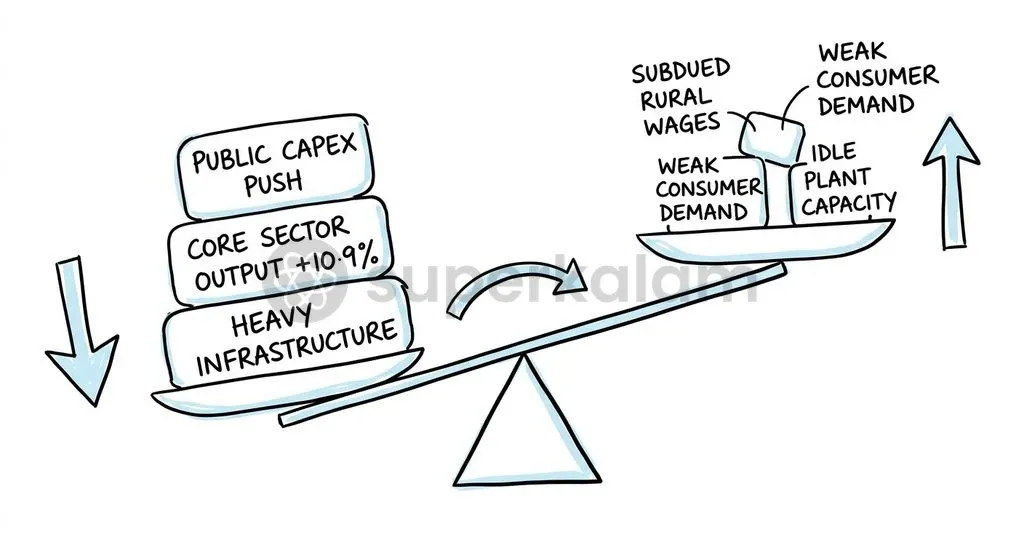
- Uneven Mass Demand: The Reserve Bank of India highlighted in its Monetary Policy Report that subdued rural real wage growth has restrained mass private consumption expenditure. While affluent urban consumers support demand for high-end automobiles and premium housing, broad-based consumption of daily goods remains muted.
Private companies will not risk capital on new industrial plants without resilient mass consumer demand.
Discuss with Superkalam
Given the target to bring the fiscal deficit below 4.5% of GDP, what structural policy interventions can revive private investment without expanding budgetary outlays?
Ask NowPolicy Roadmap: Turning Government Push into a Durable Private Investment Cycle
Public capex cannot carry economic expansion indefinitely.
Sustaining industrial expansion requires shifting the growth engine from state budgetary spending to organic private enterprise. The Union Budget outlined a clear glide path to consolidate the central fiscal deficit below 4.5% of gross domestic product. As fiscal consolidation caps the pace of public budget growth, private capital spending must step in to prevent an industrial slowdown.
Policymakers must pursue targeted measures to bridge the gap between heavy infrastructure supply and private consumption demand:
- Stimulate Mass Consumption: Support rural household disposable incomes by linking skill upgrades to rural industrial clusters, helping raise non-farm wage earnings.
- Expand Risk-Sharing Frameworks: Broaden public-private partnership models with hybrid annuity options for urban infrastructure and cold-storage agricultural chains.
- Rationalise Domestic Supply Tariffs: Lower input customs duties on intermediate industrial parts to lower baseline production costs for domestic manufacturing units.
- Revitalise Labour-Intensive Manufacturing: Extend credit guarantees and output incentives to textile, leather, and consumer appliance sectors to drive broader private capex and job creation.
Key Takeaways
- The Index of Eight Core Industries expanded by 10.9% year-on-year in October 2026, supported by an upwardly revised 8.2% expansion in September.
- A favourable base effect of 0.8% growth in October 2025 amplified the headline expansion, while cumulative growth stood at 6.0% for April–October 2026.
- The eight core segments hold a 40.27% combined weight in the Index of Industrial Production, led by petroleum refinery products, electricity generation, and steel production.
- Public capital expenditure reached ₹12.2 lakh crore in FY 2026-27, driving rapid expansions in iron ore, coal, and cement output.
- Manufacturing capacity utilisation stood at 74.6% in Q1:2026-27, lingering below the critical 75% to 80% range needed to spur wide-scale private capex.
- Subdued mass consumer demand and uneven rural wage growth remain structural barriers to crowding in broad private corporate investment.
Mains Question
"Despite record public capital outlays and historically clean commercial bank balance sheets, private corporate investment in India remains sluggish." Critically examine the structural bottlenecks preventing public capex from crowding in broad-based private investment. (15 Marks)
Evaluate NowMains Question
Highlighting the composition and weightage of the Index of Eight Core Industries, elucidate how state-led capital investment has shaped recent industrial growth trends. (10 Marks)
Evaluate NowPractice MCQs
QUESTION 1
With reference to the Index of Eight Core Industries in India, consider the following statements:
- It is published monthly by the Office of the Economic Adviser under the Department for Promotion of Industry and Internal Trade.
- The eight core industries have a combined weightage of more than 50% in the Index of Industrial Production (IIP).
- Among the eight core sectors, petroleum refinery products command the largest weight.
Which of the statements given above is/are correct?
QUESTION 2
Regarding the capital expenditure dynamics and financing mechanisms discussed in the context of Indian industrial output, consider the following statements:
- The Scheme for Special Assistance to States for Capital Investment provides 50-year interest-free loans to states for capital projects.
- Internal corporate accruals funded over 65% of aggregate private capital spending in FY 2025-26.
- Private sector capex in recent years has broadened extensively into traditional labour-intensive manufacturing sectors like textiles.
Which of the statements given above is/are correct?
QUESTION 3
According to empirical benchmarks and survey findings highlighted by the Reserve Bank of India (RBI), which of the following is considered the threshold level of manufacturing capacity utilisation required to trigger broad-based greenfield private capital expenditure?
QUESTION 4
Consider the following statements regarding the performance and drivers of India's core industrial sectors:
- In October 2026, electricity generation provided the largest weighted contribution to the overall composite core acceleration.
- A low base effect contributed to the double-digit headline core growth in October 2026, as core output had expanded by only 0.8% in October 2025.
- All eight core industry components registered positive year-on-year growth during October 2026.
Which of the statements given above is/are correct?
QUESTION 5
Which of the following correctly lists the core industries in descending order of their weightage in the Index of Eight Core Industries?