National Household Travel Survey 2025-26: Key Findings
The NSO survey covers household travel in July 2025-June 2026. Read its scope, commuting patterns, overnight journeys and key findings for UPSC.
Oct, 2026
•11 min read
Overview
The National Statistical Office launched India's first-ever comprehensive National Household Travel Survey to generate baseline empirical evidence on passenger mobility, commuting expenditures, and modal choices across rural and urban corridors. Conducted under the Ministry of Statistics and Programme Implementation between July 2025 and June 2026, this nationwide statistical exercise addresses a long-standing data vacuum in transport planning. By enumerating over two million individuals across 4.92 lakh households, the survey provides granular origin-destination patterns and modal splits required to align public transit investments with actual passenger demand. This transition from fragmented administrative estimates to a unified household mobility framework forms the empirical foundation for sustainable urban transit and multi-modal national infrastructure planning.
Why is the National Household Travel Survey in the News?
The Ministry of Statistics and Programme Implementation instituted the National Household Travel Survey across India to capture comprehensive baseline data on passenger mobility patterns between July 2025 and June 2026. Prior to this nationwide exercise, transport planning in India relied predominantly on vehicle registration counts, toll collection records, and isolated municipal traffic studies. As of October 2026, the release of the survey framework under the 80th Round of the National Sample Survey establishes the country's first centralised statistical architecture for household mobility.
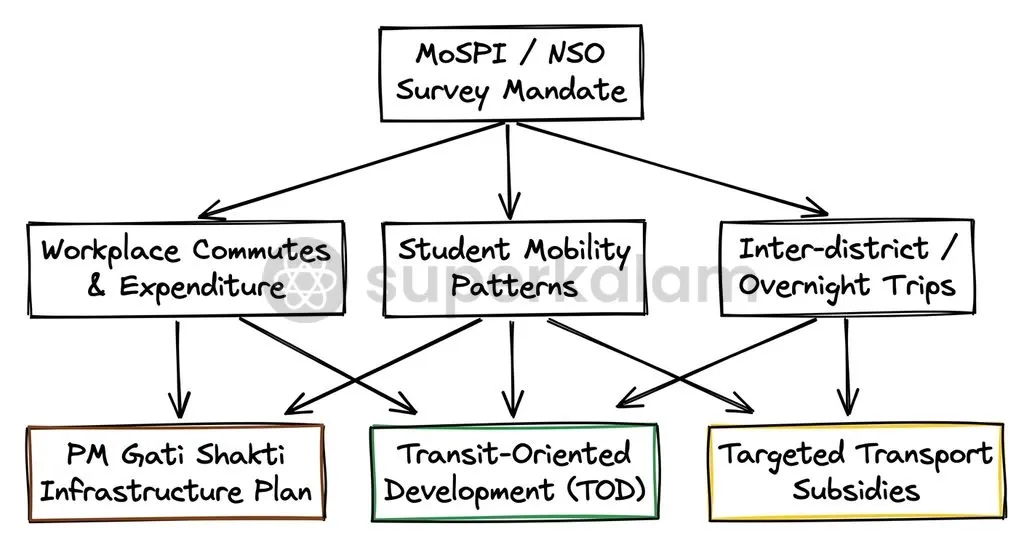
Transport infrastructure execution under national master plans requires precise, origin-destination travel metrics to prevent misallocated capital investments. According to the Ministry of Statistics and Programme Implementation, the survey directly supplies spatial demand matrices to central infrastructure ministries, including the Ministry of Railways and the Ministry of Road Transport and Highways. This data release equips urban planners and transport economists with verified baselines on passenger travel duration, expenditure disparities, and public transit adoption.
Discuss with Superkalam
What minimum travel distance did the NSO define as a qualifying trip for the National Household Travel Survey?
Ask NowUnderstanding the Survey: Objectives and Institutional Mandate
The National Statistical Office operates under the Ministry of Statistics and Programme Implementation with the statutory mandate to conduct large-scale socio-economic sample surveys across India. While regular survey rounds evaluate consumer expenditure, periodic labour force metrics, and health access, passenger travel behaviour lacked a dedicated nationwide survey mechanism. The National Household Travel Survey bridges this structural gap by capturing passenger demand across administrative boundaries.
According to official survey documentation, central planning authorities require empirical evidence on how citizens navigate spatial distances to access livelihoods and education. The survey protocol captures household trip frequency, primary and secondary transport modes, travel expenditures, and journey durations across both rural and urban settlements. This institutional framework ensures that passenger demand matrices serve as primary inputs for national transit programmes rather than post-facto engineering assumptions.
Survey Methodology: Sampling Design and Coverage Across India
The National Statistical Office deployed a stratified multi-stage sampling methodology to survey 4,92,023 households across 14,274 rural villages and 10,377 urban blocks. Field enumerators collected detailed mobility records covering 20,34,371 individuals nationwide between July 2025 and June 2026. This sampling frame ensures statistical representation across distinct geographic terrains, settlement densities, and regional economic profiles.
To ensure methodological precision, the survey framework defines a qualifying trip as domestic travel covering a distance of more than 1 kilometre, explicitly excluding movements below this threshold. The sampling design accounts for seasonal variations in passenger mobility by staggering household enumeration across four sub-rounds over the twelve-month survey duration. This temporal spread captures agricultural harvesting cycles, academic school terms, and seasonal migration patterns that alter transport demand across Indian states.
| Survey Parameter | Methodological Standard / Metric | Scope and Coverage |
|---|---|---|
| Geographic Coverage | 14,274 villages and 10,377 urban blocks | All Indian States and Union Territories |
| Sample Size | 4,92,023 households; 20,34,371 individuals | Pan-India representative sample |
| Qualifying Trip Threshold | Domestic journey > 1 kilometre | Excludes ultra-short trips ≤ 1 km |
| Temporal Framework | July 2025 to June 2026 (Four Sub-Rounds) | Continuous 12-month seasonal enumeration |
| Primary Survey Instrument | Schedule NHTS25 (CAPI digital schedule) | Direct personal household interview |
Discuss with Superkalam
How does transitioning from vehicle registration counts to household-level origin-destination matrices improve transport planning accuracy?
Ask NowCore Parameters: How NSO Defines Trips, Commutes, and Travel Modes
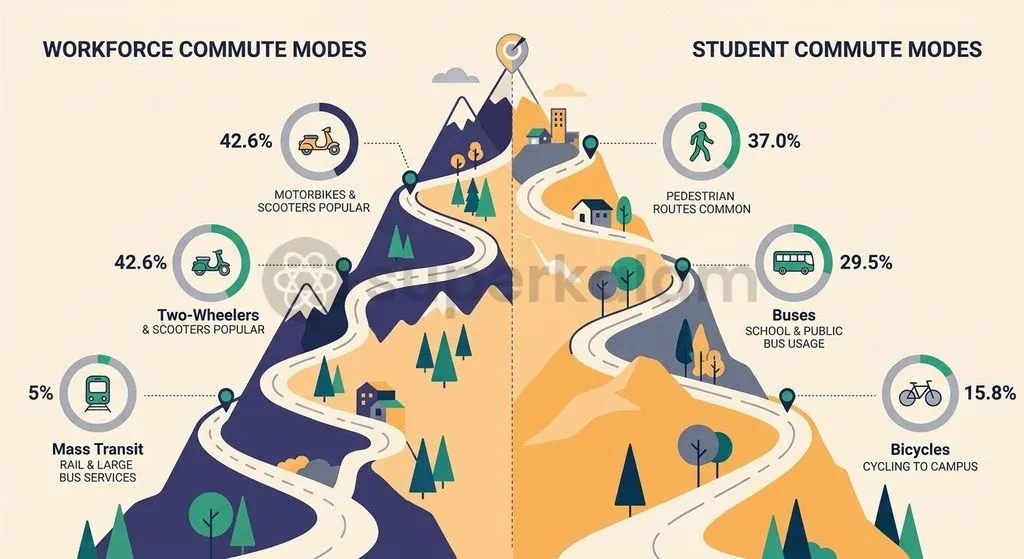
The National Household Travel Survey categorises mobility into daily workplace commutes, educational journeys, and overnight household travel. According to survey findings released by the Ministry of Statistics and Programme Implementation, 57.6% of workers aged 15 years and above undertake within-travel-day trips exceeding 1 kilometre to reach fixed or non-fixed workplaces. Personal motorised transport dominates workforce mobility, with two-wheelers accounting for 42.6% of all commuting workers travelling to fixed workplaces.
Workplace commuting patterns demonstrate high dependency on private two-wheelers, whereas organised mass transit registers limited modal share. Mass rapid transit systems, including metro rail, monorail, suburban rail, and trams, account for approximately 5% of urban commutes nationally. Commuting durations remain relatively compact across the country; 83.4% of workers reach workplaces in under 30 minutes, recording a national average duration of 25 minutes. Regional variations remain pronounced, as Northeastern states register average travel times of 15 to 19 minutes, while western and central states average 20 to 23 minutes.
Student mobility exhibits distinct structural patterns dominated by non-motorised transit and public bus networks. Nationally, 66.4% of students aged six years and above travel more than 1 kilometre daily to attend educational institutions. Walking serves as the primary mode of travel for 37.0% of students, followed by buses at 29.5% and bicycles at 15.8%. Among youth aged 15 to 29 years, educational trip participation reaches 79.1% in rural areas and 73.3% in urban centres. Furthermore, 82.0% of students commence journeys between 7:00 AM and 10:00 AM, with 87.6% reaching their institutions within 30 minutes.
For long-distance mobility, household overnight journeys rely heavily on surface public transport. Buses and railways together comprise 73.5% of total overnight travel (buses accounting for 55.8% and railways 17.7%), followed by private cars at 15.1% and two-wheelers at 8.8%.
Data Collection Strategy: Digital Tools and Fieldwork Architecture
Field enumerators executed the National Household Travel Survey under the 80th Round using Computer-Assisted Personal Interviewing on dedicated handheld digital devices. This digital framework replaced physical paper schedules with automated validation algorithms, ensuring consistent error checks during live household interviews. Handheld data entry reduces survey transmission lags and improves the integrity of geo-referenced primary records.
The digital survey instrument records granular economic data alongside physical journey vectors. The national average monthly expenditure incurred by a worker commuting to a fixed workplace is ₹785 per month, with urban commuters spending ₹1,044 per month compared to ₹612 per month for rural workers. The data reveals an acute gender disparity in commuting expenditure: male workers spend an average of ₹835 monthly, whereas female workers spend ₹533 monthly.
Discuss with Superkalam
Given that mass transit accounts for only ~5% of urban commutes while two-wheelers account for 42.6%, how can city authorities reallocate transport budgets to boost public transit adoption?
Ask NowWhy India Needs Granular Travel Data: Infrastructure and Policy Imperatives
National infrastructure initiatives require empirical household origin-destination matrices to optimise capital allocation across rail, road, and urban transit networks. The survey framework supplies spatial passenger movement layers directly to the PM Gati Shakti National Master Plan, facilitating multi-modal connectivity between residential suburbs and industrial employment clusters. Empirical trip-generation data prevents over-engineering of low-demand corridors while identifying under-served public transit routes.
Granular mobility data provides critical institutional inputs for inter-governmental fiscal transfers and targeted transport subsidies. In the United Kingdom, the Department for Transport utilises its continuous National Travel Survey to calculate local authority bus subsidies and evaluate statutory fare concessions like the English National Concessionary Travel Scheme. Similarly, the United States Federal Highway Administration uses its National Household Travel Survey to track Vehicle Miles Traveled and apportion Federal Transit Administration formula grants.
In the Indian federal structure, empirical data from the National Household Travel Survey enables the Ministry of Housing and Urban Affairs and the Ministry of Road Transport and Highways to design objective, performance-linked transit grants for states. State transport undertakings can utilise route-level expenditure and modal split data to rationalise bus fares and justify targeted viability gap funding from central schemes.
| Country / Agency | Survey Instrument | Core Governance and Policy Applications |
|---|---|---|
| India (MoSPI / NSO) | National Household Travel Survey (NHTS) | PM Gati Shakti integration, suburban transit planning, and multi-modal spatial matrices |
| United Kingdom (DfT) | National Travel Survey (NTS) | Local authority bus subsidy allocations and statutory concessionary fare evaluations |
| United States (FHWA) | National Household Travel Survey (NHTS) | Vehicle Miles Traveled (VMT) analysis and FTA formula grant distribution to states |
Key Challenges in Capturing Informal Mobility and Rural Transit
Household travel surveys in developing economies encounter substantial methodological friction due to the dominance of unorganised and informal transit systems. A primary operational challenge lies in enumerating intermediate public transport, such as shared auto-rickshaws, e-rickshaws, and informal minibuses, which lack fixed timetables or ticketed fare records. These informal modes provide essential last-mile connectivity but are often aggregated into generic transit categories, masking local bottlenecks.
Capturing complex multi-leg journeys creates another statistical hurdle during household interviews. Commuters combining walking, informal shared transit, and suburban rail often misreport intermediate transfer times or out-of-pocket costs, leading to recall errors in non-routine travel. Furthermore, short-term circular seasonal migrants frequently fall outside standard resident household sampling frames, under-representing the transit demands of vulnerable construction and agricultural workers.
Discuss with Superkalam
What underlying socio-economic factors explain the observed disparity between male (₹835) and female (₹533) monthly commuting expenditures?
Ask NowWay Forward: Leveraging Mobility Data for Sustainable Transport Planning
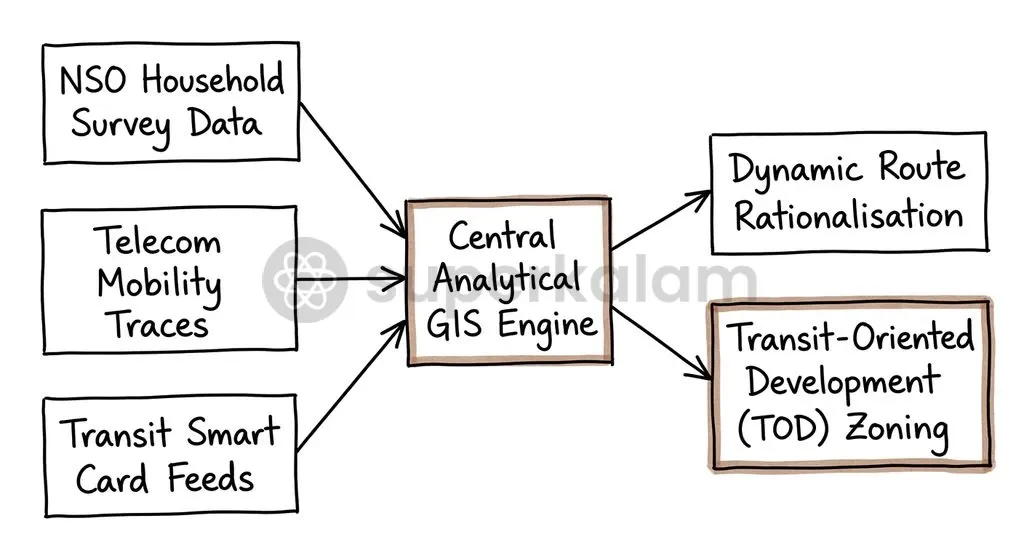
The Ministry of Statistics and Programme Implementation recommends integrating National Household Travel Survey data with dynamic digital platforms to guide urban spatial design. By fusing survey-based origin-destination matrices with geographic information system layers, telecom mobility traces, and transit smart card records, municipal corporations can establish data-driven Transit-Oriented Development zones.
Evidence-based route rationalisation must prioritise high-volume non-motorised and bus corridors revealed by the survey. Given that walking and cycling account for over half of all student commutes, municipal authorities must direct capital toward segregated non-motorised transit corridors and safe school zones. Establishing continuous, institutionalised household travel surveys will ensure that transport planning in India evolves dynamically alongside rapid urbanisation and economic growth.
Key Takeaways
- The National Statistical Office under MoSPI conducted India's first all-India National Household Travel Survey between July 2025 and June 2026 across 4,92,023 households and 20,34,371 individuals.
- Qualifying survey trips are defined as domestic journeys exceeding 1 kilometre, capturing workforce commutes, student mobility, and household overnight travel.
- Two-wheelers dominate workforce travel to fixed workplaces at a 42.6% modal share, while mass rapid transit modes account for approximately 5% of urban commutes.
- Students rely heavily on non-motorised transit, with walking comprising 37.0% of journeys to educational institutions, followed by buses at 29.5% and bicycles at 15.8%.
- The national average monthly commuting expenditure for fixed-workplace workers stands at ₹785, exhibiting substantial urban-rural (₹1,044 vs ₹612) and gender disparities (₹835 for men vs ₹533 for women).
- Survey data serves as a critical spatial input layer for the PM Gati Shakti National Master Plan, enabling data-backed transport fund devolution and Transit-Oriented Development.
Mains Question
"Transport infrastructure planning in India is shifting from fragmented administrative estimates to verified, household-level origin-destination matrices." In light of the National Household Travel Survey (80th Round), elucidate how empirical mobility data aids sustainable transport planning and national infrastructure coordination. (10 Marks)
Evaluate NowMains Question
"The findings of the National Household Travel Survey reveal stark structural disparities in modal split, transit expenditure, and gender-differentiated mobility." Critically analyse the key mobility patterns revealed by the survey and their implications for public transit investments in India. (15 Marks)
Evaluate NowPractice MCQs
QUESTION 1
With reference to the National Household Travel Survey (NHTS) conducted under the 80th Round of the National Sample Survey, consider the following statements:
- It was conducted by the National Statistical Office under the Ministry of Statistics and Programme Implementation.
- In its methodology, a qualifying trip explicitly includes all movements starting from 500 metres and above.
- The sampling design utilized four sub-rounds across a twelve-month duration to capture seasonal variations.
Which of the statements given above are correct?
QUESTION 2
Regarding the findings on workforce commuting patterns from the National Household Travel Survey, consider the following statements:
- Two-wheelers account for more than 40% of all commuting workers travelling to fixed workplaces.
- Mass rapid transit systems (metro rail, suburban rail, and trams) account for over 25% of national urban commutes.
- Over 80% of workers reach their workplaces within 30 minutes, recording a national average duration of 25 minutes.
Which of the statements given above is/are correct?
QUESTION 3
Consider the following statements regarding student mobility and overnight travel patterns captured by the National Household Travel Survey:
- Walking is the single largest primary mode of travel for students aged six years and above.
- Buses and railways together account for more than 70% of total household overnight journeys.
- A majority of students commence their educational journeys between 7:00 AM and 10:00 AM.
Which of the statements given above are correct?
QUESTION 4
According to the National Household Travel Survey data on commuting economics, what is the reported national average monthly expenditure incurred by a worker commuting to a fixed workplace?
QUESTION 5
Which digital tool and schedule framework was deployed by the National Statistical Office for data collection in the National Household Travel Survey (80th Round)?