Mercator vs Equal Earth Projection: How Maps Shape Global Power
As the UN moves away from Eurocentric maps, the rise of equal-area projections challenges centuries of cartographic bias shaping global geopolitics.
Sep, 2026
•9 min read

Context
In September 2026, the United Nations General Assembly adopted a resolution endorsing the worldwide adoption of equal-area map projections. The resolution highlighted the Equal Earth projection to counter centuries of cartographic distortion that visually diminished the Global South.
This shift challenges the persistent visual hierarchy of the traditional Mercator projection, which inflates polar regions while shrinking equatorial continents. As digital mapping evolves, understanding these mathematical compromises is vital for international governance and cartographic ethics.
Why Map Projections Are Back in the Geopolitical Spotlight
The United Nations General Assembly sparked a worldwide cartographic debate on 4 September 2026 by adopting a resolution to promote equal-area map projections across educational and official platforms. Sponsored by Togo on behalf of African member states, the resolution formally encouraged international institutions to phase out Eurocentric projections in favour of proportional alternatives like the Equal Earth projection.
The resolution passed with an overwhelming majority of 164 votes in favour, 1 against (the United States), and 6 abstentions, including Estonia, Georgia, Lithuania, Moldova, Serbia, and Ukraine. This diplomatic push highlights that maps are not neutral scientific drawings, but instruments of visual power.
For centuries, standard world maps have visually understated the geographic scale of developing nations across the equatorial belt. The diplomatic consensus at the UN marks a major institutional transition towards decolonising spatial data in global governance, international law, and classroom education.
How Cartographic Distortion Works: The Geometric Dilemma
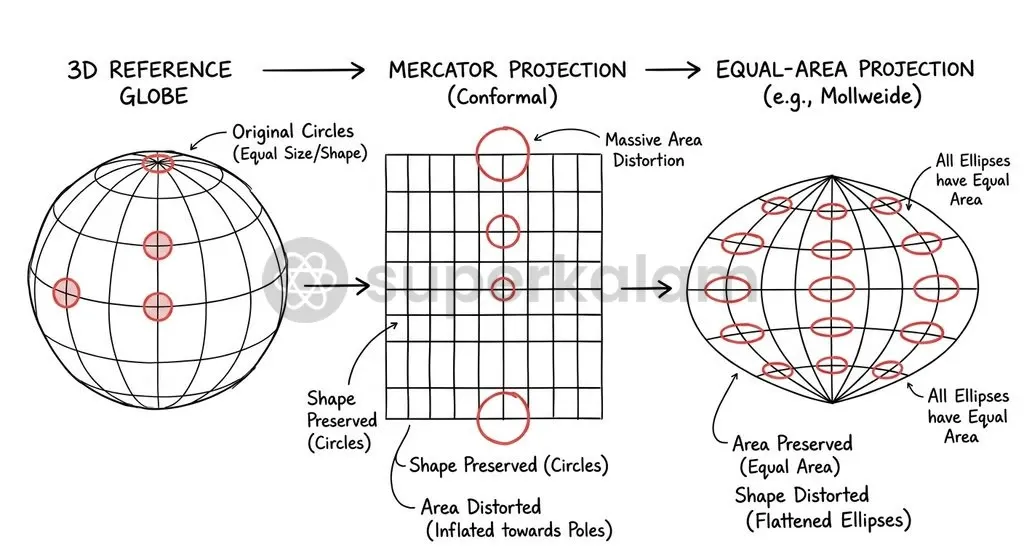
Carl Friedrich Gauss established the mathematical impossibility of creating a perfectly flat world map in his 1828 Theorema Egregium. The theorem proves that a three-dimensional sphere with positive Gaussian curvature cannot be projected onto a two-dimensional Euclidean plane without distorting distance, shape, direction, or surface area.
Every two-dimensional map requires a mathematical compromise between competing geometric properties:
- Conformality (Shape and Angle Preservation): Maintains local angles and true compass bearings, which distorts land area at varying latitudes.
- Equivalence (Equal-Area Preservation): Preserves relative surface sizes across all regions, but alters familiar landmass shapes.
- Equidistance: Retains accurate scale along specific standard lines, though not uniformly across the entire map.
- Compromise (Aphylactic): Balances distortions across shape, area, and scale without preserving any single metric perfectly.
French mathematician Nicolas Auguste Tissot devised Tissot's indicatrix in 1859 to quantify local projection distortion. Cartographers project infinitesimal reference circles from a globe onto a flat plane to examine how they deform into ellipses. The size and eccentricity of these ellipses reveal the exact nature of regional distortion across different map projections.
Discuss with Superkalam
Which 1828 mathematical theorem proved that flattening a spherical Earth onto a 2D map without distortion is impossible?
Ask Now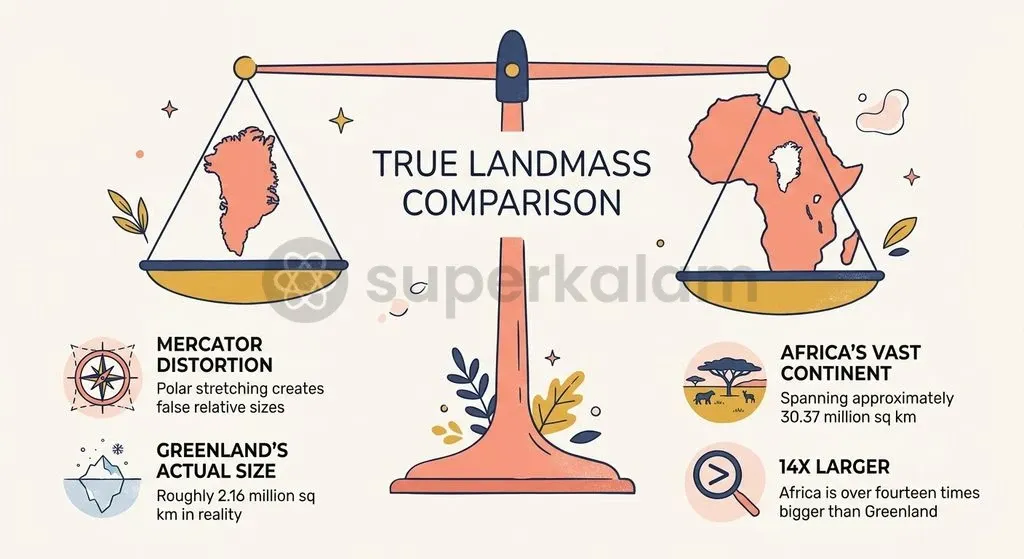
The Rise of Equal-Area Maps: Gall-Peters to the Equal Earth Projection
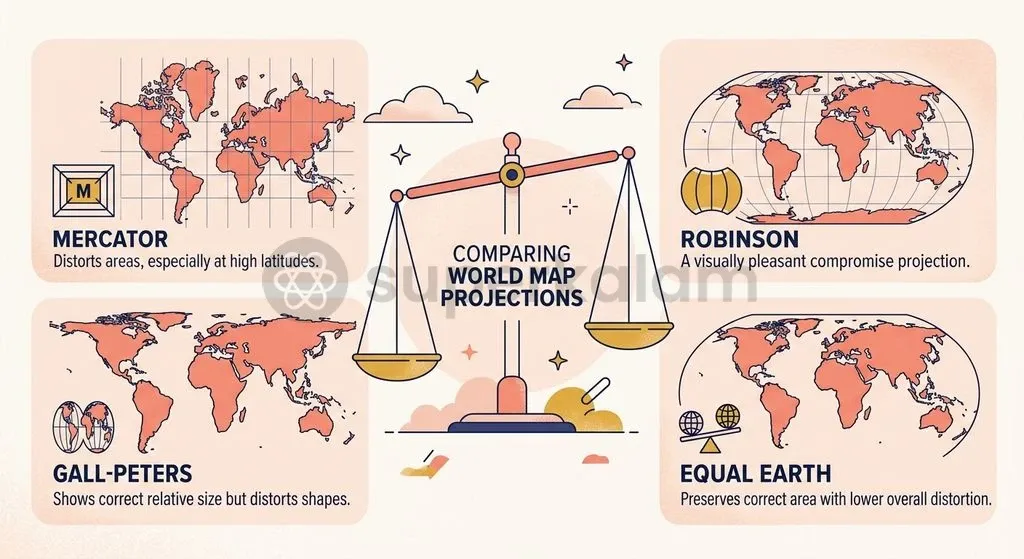
Arno Peters presented the Gall-Peters projection in 1973, building upon James Gall's 1855 equal-area cylindrical design. The Gall-Peters projection corrected area imbalances by showing continents at their true relative sizes, sparking debate over cartographic imperialism. However, the projection introduced severe visual distortions, stretching tropical landmasses vertically while compressing polar regions horizontally.
To address these aesthetic challenges, cartographers developed intermediate compromise maps:
- Robinson Projection (1963): Arthur H. Robinson built a compromise pseudocylindrical projection that balanced shape and area distortions without being strictly conformal or equal-area. The National Geographic Society used it as their standard reference map from 1988 to 1998.
- Winkel Tripel Projection (1921): Designed by Oswald Winkel, this projection minimises area, direction, and distance distortion simultaneously. The National Geographic Society adopted it in 1998 to replace Robinson.
Cartographers Bojan Šavrič, Tom Patterson, and Bernhard Jenny created the Equal Earth projection in 2018 as an equal-area pseudocylindrical alternative. Equal Earth preserves true relative surface areas while maintaining visually pleasing continent shapes. The projection uses straight, equally spaced latitude parallels and curved meridians with short pole lines, avoiding extreme shape shearing.
Discuss with Superkalam
How does grid spacing along the secant of latitude explain the visual exaggeration of high-latitude regions on a Mercator map?
Ask NowHead-to-Head Comparison: Mercator, Gall-Peters, Robinson, and Equal Earth
World map projections differ systematically in their mathematical construction, distortion profiles, and intended applications. The following comparison outlines the trade-offs between major historical and modern projections:
| Feature / Metric | Mercator (1569) | Gall-Peters (1973 / 1855) | Robinson (1963) | Equal Earth (2018) |
|---|---|---|---|---|
| Projection Family | Conformal Cylindrical | Equal-Area Cylindrical | Compromise Pseudocylindrical | Equal-Area Pseudocylindrical |
| Area Accuracy | Highly distorted; inflates polar latitudes | Mathematically accurate (1:1 area ratio) | Distorted; moderate compromise | Mathematically accurate (1:1 area ratio) |
| Shape Accuracy | Preserved locally (conformal) | Severely stretched at equator, compressed at poles | Visually balanced; minor distortion | Visually balanced; minimal equatorial distortion |
| Parallels & Meridians | Straight lines intersecting at 90° angles | Straight lines intersecting at 90° angles | Straight parallels, curved outer meridians | Straight parallels, curved outer arced meridians |
| Primary Use Case | Marine navigation, coastal nautical charting | Thematic social justice, political advocacy | General atlas display, educational wall maps | Global data visualisations, thematic area maps |
| Key Limitation | Grossly exaggerates landmasses in northern latitudes | Distorts familiar continental outlines | Fails mathematical equal-area tests | Minor shape shearing near high-latitude edges |
Discuss with Superkalam
If a global health organization presents epidemiological data using a standard Mercator map, what visual misperceptions might arise regarding tropical disease burdens?
Ask NowWhy Cartographic Bias Matters for Global Governance and the Global South
Cartographic representation influences international relations, environmental policy priorities, and global perceptions of economic importance. When world maps shrink Africa, South Asia, and South America, they visually understate the demographic scale, resource wealth, and geopolitical weight of the Global South.
Physical land area directly affects how the public and policymakers assess global challenges:
- Climate Vulnerability and Carbon Accounting: Under-representing equatorial landmasses diminishes the visual scale of vital ecosystems, including the Congo Basin and the Amazon rainforest.
- Epidemiological Disease Burden: Visual compression of tropical zones can skew public perception regarding the geographic distribution of global health challenges.
- Geopolitical and Demographic Weight: Proportional equal-area representations help counter outdated colonial-era hierarchies in multilateral forums.
United Nations cartographic operations operate under Administrative Instruction ST/AI/189/Add.25/Rev.1. This directive requires formal clearance from the UN Geospatial Information Section and mandates specific boundary disclaimers on political publications to prevent unintentional sovereign bias.
Ethical Cartography and India's Policy on Geospatial Representation
Cartographic governance in India balances open geospatial innovation with strict statutory safeguards over sovereign territorial integrity. The Department of Science and Technology (DST) updated the national mapping framework by notifying the Guidelines for Acquiring and Producing Geospatial Data on 15 February 2021. This policy deregulated domestic spatial data collection while maintaining restrictions on sensitive national security attributes.
The Indian government strengthened this framework on 28 December 2022 by notifying the National Geospatial Policy, 2022, which replaced the National Map Policy of 2005, Notification No. SM/25/07/2021 (E-33381)]. The policy outlines a strategy to build high-resolution national topographic databases and unified digital platforms by 2030–2035.
Statutory boundaries and territorial depictions remain strictly regulated under Indian law:
- Survey of India Mandate: Established in 1767 under the Department of Science and Technology, the Survey of India is the National Survey and Mapping Organisation, establishing geodetic reference frameworks and verifying international borders on published maps.
- Criminal Law Amendment Act, 1961: Section 2 penalises the publication and distribution of maps that question India's territorial integrity or misrepresent its international borders contrary to official alignments.
International mapping platforms and global tech providers operating in India must align their territorial visualisations with official Survey of India boundary alignments to maintain legal compliance and cartographic accuracy.
Discuss with Superkalam
Compare the compromises made by the Gall-Peters projection versus the Equal Earth projection in achieving equal-area representation.
Ask NowThe Way Forward: Balancing Spatial Accuracy and Geopolitical Fairness
Global mapping practices are shifting toward multi-projection frameworks that select projection systems based on their specific analytical purpose. Navigational systems and local spatial interfaces rely on conformal models like Web Mercator for route navigation, whereas international governance, thematic mapping, and education require equal-area models like the Equal Earth projection.
Standardising equitable cartography requires coordinated action across three main sectors:
- Digital Platform Standards: Major technology companies and open-source mapping libraries should implement equal-area projections like Equal Earth as default settings for global thematic data visualisations.
- Educational Curriculum Updates: National education boards and geography curricula should teach map projections comparatively, using Tissot's indicatrix to demonstrate how projection choices affect spatial perception.
- Multilateral Geospatial Norms: International organisations should adopt standardised equal-area cartography across environmental monitoring, climate financing models, and demographic reporting platforms.
Choosing fair projections ensures that international policy debates reflect accurate geographic scale, helping align global governance with true physical geography.
Key Takeaways
- Gauss's Theorema Egregium (1828) establishes that flattening a 3D sphere onto a 2D map inevitably distorts area, angle, distance, or direction.
- The 1569 Mercator projection preserves rhumb lines for compass navigation, but inflates high-latitude regions, making Greenland appear equal in size to Africa despite Africa being roughly 14 times larger.
- The Equal Earth projection (2018) provides an equal-area representation with balanced visual continental shapes, offering an alternative to the distorted Gall-Peters map.
- On 4 September 2026, the UN General Assembly adopted a resolution sponsored by Togo (164 votes in favour, 1 against) encouraging global adoption of equal-area projections.
- India's geospatial regime is guided by the National Geospatial Policy, 2022, with border representations regulated by the Survey of India under Section 2 of the Criminal Law Amendment Act, 1961.
Mains Question
"Maps are not neutral scientific drawings, but instruments of visual power that have historically reinforced geopolitical hierarchies." In light of the September 2026 UN General Assembly resolution endorsing equal-area map projections, elucidate how cartographic distortion impacts global perceptions of the Global South and evaluate the Equal Earth projection as a viable alternative. (15 Marks)
Evaluate NowMains Question
Examine the mathematical constraints governing two-dimensional map projections as outlined by Gauss's Theorema Egregium, and discuss the trade-offs between conformal and equal-area projections. (10 Marks)
Evaluate NowPractice MCQs
QUESTION 1
Consider the following statements regarding geometric principles in cartography:
- Carl Friedrich Gauss's Theorema Egregium establishes that a three-dimensional sphere with positive Gaussian curvature cannot be projected onto a flat plane without distortion.
- Tissot's indicatrix uses infinitesimal reference circles to quantify local distortion by observing their deformation into ellipses.
- A conformal map projection preserves true relative surface area across all latitudes while sacrificing angular accuracy.
Which of the statements given above are correct?
QUESTION 2
Consider the following statements regarding the Mercator projection:
- It plots lines of constant compass bearing, known as rhumb lines or loxodromes, as straight lines.
- Grid spacing increases with the secant of latitude away from the equator, causing polar landmasses to expand.
- In the standard Mercator projection, Greenland is depicted as roughly equal in size to Africa, despite Africa being approximately 14 times larger.
Which of the statements given above are correct?
QUESTION 3
With reference to world map projections, consider the following pairs:
- Gall-Peters Projection : Equal-Area Cylindrical
- Robinson Projection : Compromise Pseudocylindrical
- Equal Earth Projection : Equal-Area Pseudocylindrical
Which of the pairs given above is/are correctly matched?
QUESTION 4
Consider the following statements regarding international and domestic geospatial governance:
- The UN General Assembly resolution of September 2026 promoting equal-area map projections was sponsored by Togo on behalf of African member states.
- United Nations cartographic operations mandate clearance and boundary disclaimers under Administrative Instruction ST/AI/189/Add.25/Rev.1.
- India's National Geospatial Policy, 2022 replaced the National Map Policy of 2005.
Which of the statements given above are correct?
QUESTION 5
The 'Web Mercator' projection (EPSG:3857), which became the standard projection for modern web-mapping infrastructure and street-level navigation, was adopted in 2005 by: