Living Planet Report: What the 73% Wildlife Drop Means for India
While India celebrates growing tiger counts, global wildlife data exposes how habitat fragmentation and legal shifts threaten long-term ecological security.
Oct, 2026
•9 min read

Context
The Living Planet Report documents an average 73% relative decline in monitored vertebrate wildlife populations between 1970 and 2022. This drop signals severe ecosystem degradation that threatens global environmental stability. Tackling it requires structural policy overhaul rather than isolated species headcounts.
Jointly published by the World Wide Fund for Nature and the Zoological Society of London, the index tracks relative population trends across 35,803 monitored populations of mammals, birds, reptiles, amphibians, and fish. Public discourse frequently mistakes this metric for an absolute loss of wild individuals. Its true significance lies in exposing ecological fragmentation and looming biome tipping points.
Headline wildlife population declines reflect systemic habitat degradation rather than simple headcount losses. India must shift focus from isolated flagship-species tallies toward statutory corridor connectivity and rigorous biodiversity governance. Rising predator numbers cannot mask fragmented ranges and recent legislative dilutions.
Why the 73% Wildlife Drop Is Making Global Headlines
The World Wide Fund for Nature released its Living Planet Report, revealing an average 73% contraction in monitored vertebrate populations between 1970 and 2022. As of October 2024, the findings framed high-level debates at the sixteenth Conference of the Parties (COP16) to the Convention on Biological Diversity held in Cali, Colombia. Monitored vertebrate populations experienced an average annual contraction rate of approximately 2.5%.
Global policymakers treat the Living Planet Report as a bellwether for planetary health. The assessment synthesises ecological datasets across five vertebrate classes: mammals, birds, reptiles, amphibians, and fish. Continued habitat destruction undermines critical ecosystem services like carbon sequestration, pollination, and hydrological regulation.
The metric exposes uneven geographic collapse rather than uniform global loss:
- Regional severity: Latin America and the Caribbean suffered an alarming average monitored wildlife decline of 95% over the same five-decade baseline.
- Targeted stress: The index highlights acute disruptions within specific biomes rather than uniform worldwide losses.
Discuss with Superkalam
Which geographic region recorded the highest monitored vertebrate decline of 95% between 1970 and 2022?
Ask NowDecoding the Math: Why 73% Does Not Mean Three-Quarters of Animals Vanished
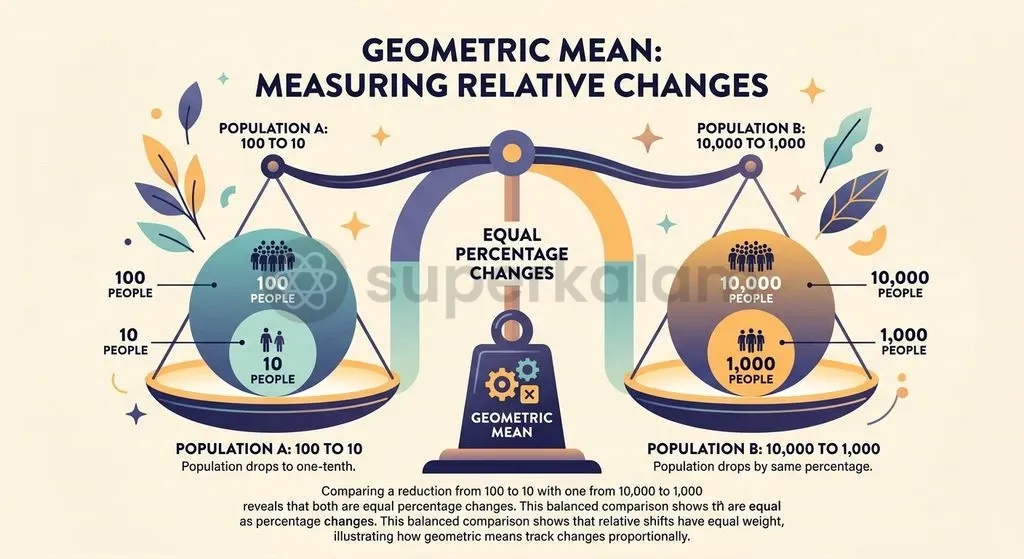
The Living Planet Index measures the geometric mean of relative population changes across monitored vertebrates, not an absolute census of individual animals lost. Public commentary routinely misinterprets the headline 73% drop as the extinction of three-quarters of all wild animals on Earth. In statistical reality, the metric tracks the average proportional rate of change across individual monitored populations.
According to Our World in Data, the dataset managed by the Zoological Society of London and the World Wide Fund for Nature covers 35,803 populations representing 5,790 vertebrate species. Across these 35,803 monitored populations between 1970 and 2022, approximately half showed population declines while the remaining half were stable or increasing. Because the index calculates relative percentage drops, a small population declining from 100 individuals to 10 carries the same mathematical weight as a population falling from 100,000 to 10,000.
| Analytical Dimension | Living Planet Index (LPI) | Absolute Wildlife Headcount |
|---|---|---|
| Primary Metric | Geometric mean of relative population trends | Total count of individual wild animals |
| Scope of Assessment | 35,803 monitored vertebrate populations | Complete census of global fauna |
| Statistical Weighting | Equal weight to proportional rate changes | Weighted entirely by numerical abundance |
| Extinction Indication | Reflects population trajectories, not extinction rates | Directly records local or global extirpations |
| Underlying Dynamics | Approximately 50% declining, 50% stable or increasing | Net arithmetic sum of surviving individuals |
This mathematical design turns the index into an early warning indicator for ecological stress. A severe percentage drop in a fragile population signals acute local degradation before complete extirpation occurs. Policymakers must therefore interpret the figure as a metric of accelerating systemic vulnerability across wildlife habitats rather than a simple global body count.
Freshwater Systems and Tipping Points: Where the Global Crisis Hits Hardest
Different biomes experience biodiversity collapse at sharply divergent rates. Inland wetlands, rivers, and riparian corridors face mounting pressures from dam construction, hydrological diversion, and untreated effluent discharge.
Monitored population declines break down across global systems:
- Freshwater ecosystems: Suffered the steepest catastrophic collapse globally, recording an average population decline of 85% between 1970 and 2022.
- Terrestrial systems: Registered an average monitored decline of 69% over the baseline period.
- Marine biomes: Recorded an average monitored contraction of 59% across monitored populations.
Habitat loss driven by global food production represents the single largest direct driver of biodiversity decline worldwide. The agricultural sector transforms biodiverse grasslands and primary forests into monoculture cropland and livestock pastures. The global food production system is responsible for roughly 30% of global greenhouse gas emissions.
Compounded biodiversity loss and climatic heating push biomes toward dangerous, irreversible tipping points. These ecological tipping points occur when gradual degradation breaches a threshold, triggering sudden structural state shifts. The assessment highlights the imminent dieback of the Amazon rainforest into a degraded savannah and mass coral reef collapse as primary systemic threats.
Discuss with Superkalam
How does using the geometric mean of relative population rates make the Living Planet Index an early warning indicator for ecological stress?
Ask NowThe Indian Dilemma: Celebrating Tiger Counts While Habitats Shrink
India hosts 75% of the world's wild tigers. Yet rising apex predator populations mask severe habitat fragmentation caused by linear infrastructure across unnotified corridors.
Recent government assessments show sustained species recoveries:
- Tiger populations: According to the fifth cycle of the All India Tiger Estimation (2022), the country supports an estimated average population of 3,682 wild tigers, with a camera-trapped minimum of 3,167 individuals.
- Snow leopards: The Snow Leopard Population Assessment in India, completed by the Wildlife Institute of India and the Ministry of Environment, Forest and Climate Change in 2024, established India's first scientific baseline headcount of 718 snow leopards across roughly 120,000 square kilometres of trans-Himalayan habitat.
These headcount gains demonstrate the efficacy of targeted, species-centric anti-poaching and monitoring investments. Yet long-term ecological viability cannot depend solely on numbers confined within isolated reserve boundaries.
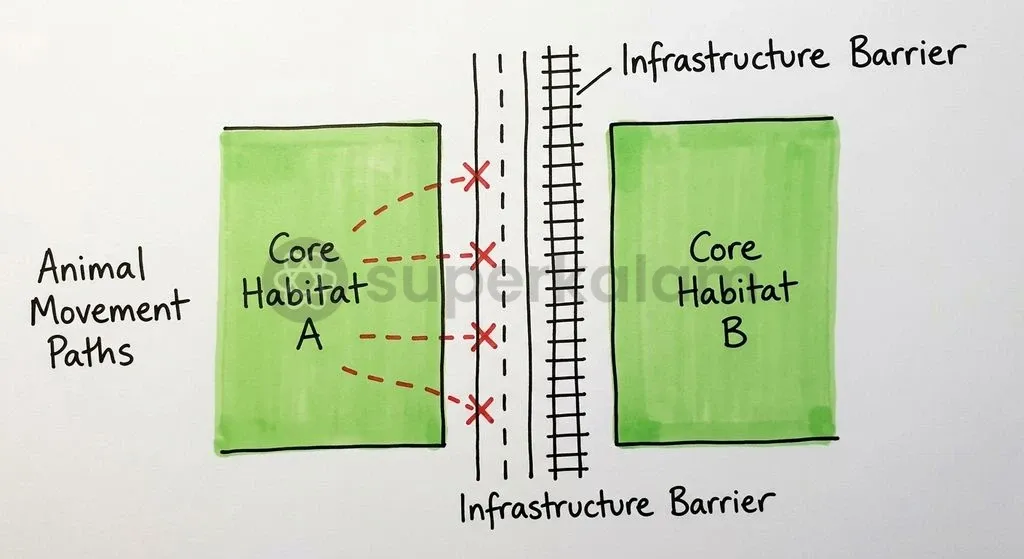
The National Tiger Conservation Authority notes that linear infrastructure projects sever unnotified wildlife corridors. High-speed rail lines, four-lane highways, and transmission corridors slice through intact landscapes. When dispersing animals face these artificial barriers, gene flow drops, generating heightened human-wildlife conflict and genetic isolation along reserve peripheries.
Discuss with Superkalam
How might linear infrastructure projects like four-lane highways cut across unnotified corridors and affect tiger gene flow between protected reserves?
Ask NowThe Legislative Shift: How the Biological Diversity Amendment Act 2023 Changes Safeguards
The Biological Diversity (Amendment) Act, 2023 fundamentally altered the enforcement architecture for biopiracy. Parliament enacted these revisions to decriminalise environmental offences and promote ease of doing business across traditional medicine sectors.
Key structural shifts under the amended statute include:
- Decriminalised enforcement: Replaced criminal imprisonment under Section 55 with civil monetary penalties ranging from ₹1 lakh to ₹50 lakh, extendable to ₹1 crore for continuous non-compliance, determined by an executive Adjudicating Officer.
- Prior intimation waivers: Under the amended Section 7, registered AYUSH medical practitioners and users accessing codified traditional knowledge are exempted from giving prior intimation to State Biodiversity Boards before accessing biological resources.
- Commercial revenue exemptions: The 2023 amendments exclude research, bio-surveys, and bio-utilisation from mandatory Access and Benefit Sharing payments.
- Commodity exclusions: The Act expands Section 40 exemptions to cover normally traded commodities and their derivatives.
Proponents argue the Section 7 reform shields rural healers and indigenous manufacturing systems from bureaucratic delays. Critics caution that commercial manufacturers can exploit this loophole to bypass state oversight. These statutory exemptions ease operational compliance for industrial bio-prospectors, but they constrain financial transfers directed back to local Biodiversity Management Committees.
Discuss with Superkalam
What are the structural trade-offs between easing compliance for AYUSH practitioners and ensuring revenue flows to Biodiversity Management Committees under the 2023 Biodiversity Amendment?
Ask NowFrom Montreal to New Delhi: Can India's Updated Biodiversity Strategy Deliver?
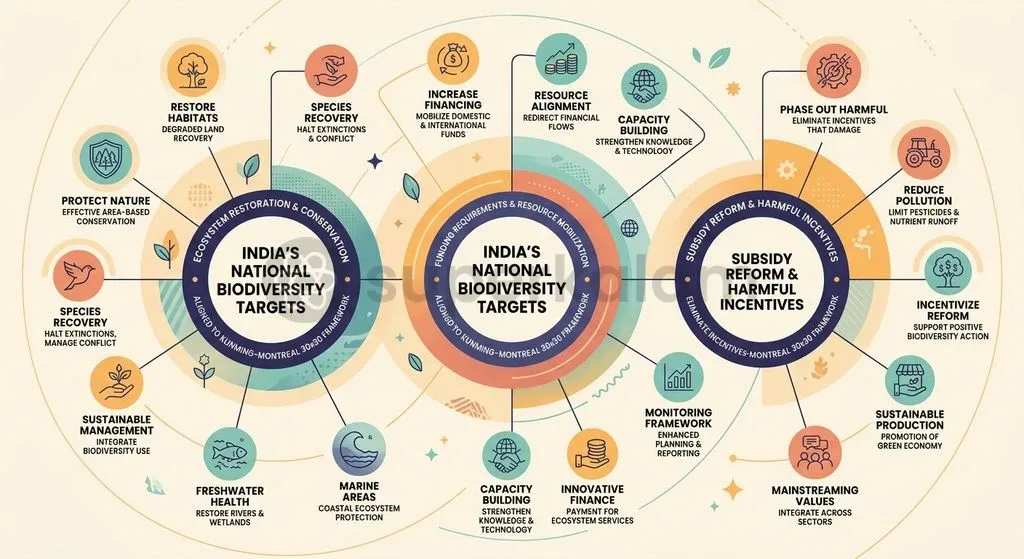
India submitted its updated National Biodiversity Strategy and Action Plan at COP16 in Cali, Colombia, aligning domestic conservation with the Kunming-Montreal Global Biodiversity Framework. The strategic document outlines 23 National Biodiversity Targets designed to tackle land degradation, invasive species, and habitat fragmentation through 2030.
Key policy pillars frame India's delivery roadmap:
- Ecosystem restoration (Target 3): Commits to restoring at least 30% of degraded terrestrial, inland water, and coastal and marine ecosystems by 2030. Fulfilling this target requires expanding protected areas while designating Other Effective Area-based Conservation Measures across community forests, coastal belts, and reserved forests.
- Domestic financial outlay: Projects an annual average domestic financial requirement of ₹81,664 crore, or approximately $9.8 billion, across the central government up to 2029–30.
- Subsidies realignment (Target 18): Mobilising these funds necessitates structural realignments under Target 18 of the Kunming-Montreal Framework, which requires nations to phase out or reform biodiversity-harmful subsidies by at least $500 billion per year globally by 2030.
Way Forward: Closing the Gap Between Headline Goals and Ground Protection
Closing the gap between headline conservation targets and on-the-ground ecological health requires structural legislative and fiscal reforms:
- Statutory protection for corridors: Grant ecological corridors statutory standing under the Wild Life (Protection) Act, 1972 to connect fragmented reserves and secure long-term genetic viability. Wildlife corridors currently lack autonomous statutory protection under the 1972 Act, leaving inter-reserve connectivity dependent on voluntary designations or ad-hoc National Board for Wildlife clearances. Legally enforceable zoning buffers prevent irreversible infrastructure fragmentation.
- Grassroots institutional rights: Implement Section 5 of the Scheduled Tribes and Other Traditional Forest Dwellers (Recognition of Forest Rights) Act, 2006. This provision vests statutory authority in the Gram Sabha to protect wildlife, forests, and biodiversity within Community Forest Resource jurisdictions. Empowering forest-dwelling communities provides a legally anchored frontline defence against illegal logging and forest conversions.
- Ecological fiscal transfers: State governments should allocate resources to local bodies that conserve intact forest cover and wetlands. In parallel, redirecting chemical fertiliser and groundwater-depleting energy subsidies into regenerative agro-ecological practices will directly tackle the primary driver of domestic habitat degradation.
Discuss with Superkalam
How should environmental policymakers resolve the tension between national agricultural expansion and meeting the 30% ecosystem restoration target by 2030?
Ask NowKey Takeaways
- The Living Planet Report documents an average 73% relative decline in monitored vertebrate populations between 1970 and 2022, representing an average annual contraction rate of 2.5%.
- The index calculates the geometric mean of proportional changes across 35,803 populations rather than an absolute headcount loss; roughly half of monitored populations were stable or increasing.
- Freshwater ecosystems suffered the steepest catastrophic collapse globally with an 85% decline, while Latin America and the Caribbean experienced an average regional drop of 95%.
- India hosts 3,682 tigers and 718 snow leopards, but expanding predator headcounts mask growing habitat fragmentation across unnotified corridors.
- The Biological Diversity (Amendment) Act, 2023 decriminalised offences under Section 55 and exempted codified traditional knowledge and AYUSH practitioners from prior intimation under Section 7.
- India's updated National Biodiversity Strategy and Action Plan projects an annual domestic financial requirement of ₹81,664 crore to meet Kunming-Montreal targets by 2030.
Mains Question
"Headline gains in apex predator headcounts risk masking severe habitat fragmentation and genetic isolation along reserve peripheries." In light of this statement, critically analyse India's wildlife conservation approach. (10 Marks)
Evaluate NowMains Question
The Biological Diversity (Amendment) Act, 2023 seeks to balance ease of doing business with conservation, but introduces significant governance trade-offs. Evaluate the implications of the amended legislative framework on local biodiversity conservation and benefit sharing. (15 Marks)
Evaluate NowPractice MCQs
QUESTION 1
Regarding the Living Planet Index (LPI), consider the following statements:
- It calculates the geometric mean of relative population changes across monitored vertebrate species.
- A 73% drop in the index indicates that three-quarters of the total individual wild animals on Earth have gone extinct.
- In its dataset, approximately half of the monitored populations showed declines while the remainder were stable or increasing. Which of the statements given above are correct?
QUESTION 2
According to the Living Planet Report findings on biome-level population contractions between 1970 and 2022, which of the following represents the correct descending order of average monitored vertebrate population decline?
QUESTION 3
Consider the following statements regarding the Biological Diversity (Amendment) Act, 2023:
- It replaces criminal imprisonment under Section 55 with civil monetary penalties adjudicated by an executive officer.
- Registered AYUSH practitioners are exempted from giving prior intimation to State Biodiversity Boards before accessing biological resources.
- Mandatory Access and Benefit Sharing payments have been extended to include bio-surveys and research activities. Which of the statements given above is/are correct?
QUESTION 4
With reference to India's biodiversity conservation data and policy commitments cited in recent official reports, consider the following statements:
- India supports 75% of the world's wild tigers, with an estimated average population of 3,682 based on the 2022 estimation.
- The Snow Leopard Population Assessment established a baseline headcount of over 1,500 individuals across the trans-Himalaya.
- Target 3 of India's updated National Biodiversity Strategy and Action Plan commits to restoring at least 30% of degraded terrestrial, inland water, and coastal and marine ecosystems by 2030. Which of the statements given above are correct?
QUESTION 5
Which of the following direct drivers is identified as the single largest cause of biodiversity loss globally, accounting for roughly 30% of global greenhouse gas emissions?