Passage
The following graph shows the average profit of two fruit-sellers A and B in thousands (Rs.) per year from the year 1995 to 2000.
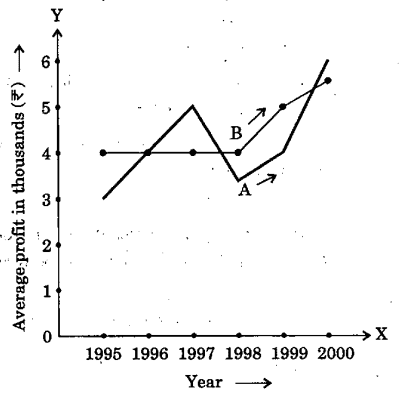
Consider the graph and answer the 4 (four) items that follow:
9
QUESTION
CSAT
Medium
Maths
Prelims 2014
What is the trend of the average profit of B from the year 1997 to the year 2000?
Select an option to attempt
Other Questions from this Passage
- MathsView Answer for: In which year is the average profit of A and B same?
In which year is the average profit of A and B same?
- MathsView Answer for: What is the difference between the average profit of B and A in the year 1998?
What is the difference between the average profit of B and A in the year 1998?
- MathsView Answer for: How much more average profit did A make in the year 2000 than in the year 1999?
How much more average profit did A make in the year 2000 than in the year 1999?
Trusted by 2L aspirants
Practice UPSC Prelims PYQs Smarter

- Track accuracy & weak areas
- See past trends & repeated themes
Crack UPSC with your
Personal AI Mentor
An AI-powered ecosystem to learn, practice, and evaluate with discipline