QUESTION
CSAT
Medium
Reasoning
Prelims 2018
The following graph indicates the composition of our tax revenue for a period of two decades :
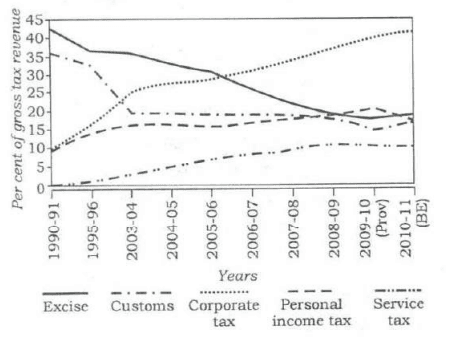
With reference to the above graph, which of the following is/are the most logical and rational inference/ inferences that can be made?
- During the given beriod, the revenue from Direct Taxes as percentage of gross tax revenue has increased while that of Indirect Taxes decreased.
- The trend in the revenue from Excise Duty demonstrates that the growth of manufacturing sector has been negative during the given period.
Select the correct answer using the code given below.
Select an option to attempt
Trusted by 2L aspirants
Practice UPSC Prelims PYQs Smarter

- Track accuracy & weak areas
- See past trends & repeated themes
Crack UPSC with your
Personal AI Mentor
An AI-powered ecosystem to learn, practice, and evaluate with discipline