QUESTION
CSAT
Hard
Maths
Prelims 2018
The figure drawn below gives the velocity graphs of two vehicles A and B. The straight line OKP represents the velocity of vehicle A at any instant, whereas the horizontal straight line CKD represents the velocity of vehicle B at any instant. In the figure, D is the point where the perpendicular from P meets the horizontal line CKD such that .
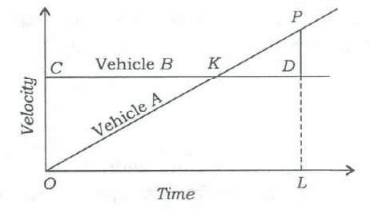
What is the ratio between the distances covered by vehicles A and B in the time interval OL?
Select an option to attempt
Trusted by 2L aspirants
Practice UPSC Prelims PYQs Smarter

- Track accuracy & weak areas
- See past trends & repeated themes
Crack UPSC with your
Personal AI Mentor
An AI-powered ecosystem to learn, practice, and evaluate with discipline