QUESTION
CSAT
Medium
Maths
Prelims 2018
Direction for the following 2 (two) items :
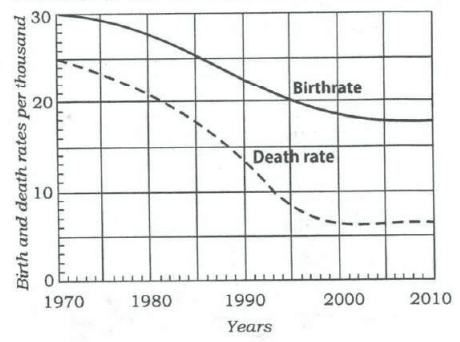
Consider the following graph in which the birthrate and death rate of a country are given, and answer the two items that follow.
Looking at the graph, it can be inferred that from 1990 to 2010
Select an option to attempt
Trusted by 2L aspirants
Practice UPSC Prelims PYQs Smarter

- Track accuracy & weak areas
- See past trends & repeated themes
Crack UPSC with your
Personal AI Mentor
An AI-powered ecosystem to learn, practice, and evaluate with discipline