QUESTION
CSAT
Hard
Reasoning
Prelims 2018
Consider the following graphs. The curves in the graphs indicate different age groups in the populations of two countries A and B over a period of few decades:
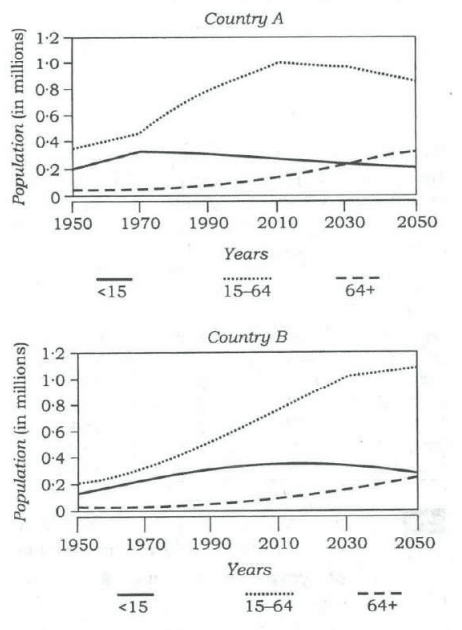
With reference to the above graphs, which of the following are the most logical and rational inferences that can be made?
- Over the last two and a half decades, the dependency ratio for country B has decreased.
- By the end of next two and a half decades, the dependency ratio of country A will be much less than that of country B.
- In the next two decades, the work-force relative to its total population will increase in country B as compared to country A.
Select the correct answer using the code given below.
Select an option to attempt
Trusted by 2L aspirants
Practice UPSC Prelims PYQs Smarter

- Track accuracy & weak areas
- See past trends & repeated themes
Crack UPSC with your
Personal AI Mentor
An AI-powered ecosystem to learn, practice, and evaluate with discipline