QUESTION
CSAT
Easy
Maths
Prelims 2015
The proportion of expenditure on various items by two families A and B are represented in the following bar charts:
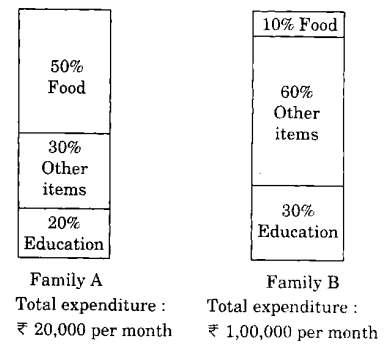
From these charts, we can conclude that:
Select an option to attempt
Trusted by 2L aspirants
Practice UPSC Prelims PYQs Smarter
- Track accuracy & weak areas
- See past trends & repeated themes
Crack UPSC with your
Personal AI Mentor
An AI-powered ecosystem to learn, practice, and evaluate with discipline