QUESTION
CSAT
Easy
Maths
Prelims 2013
Consider the following diagrams:
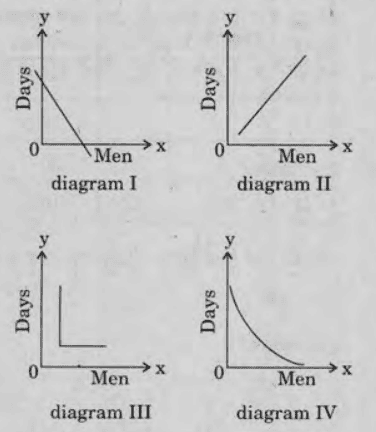
men, working at a constant speed, do a certain job in days.
Which one of these diagrams shows the relation between and ?
Select an option to attempt
Trusted by 2L aspirants
Practice UPSC Prelims PYQs Smarter

- Track accuracy & weak areas
- See past trends & repeated themes
Crack UPSC with your
Personal AI Mentor
An AI-powered ecosystem to learn, practice, and evaluate with discipline