GS 2: GovernanceGS 2: Social JusticeGS 3: EconomyPrelimsGS 3: Indian Economy, Planning, Mobilization of Resources, Growth, Development and Employment
A Poverty Line That Falls Short, Pg7
Conflicting poverty lines, from Tendulkar to World Bank, yield vastly different estimates (5-26%), challenging India's true progress and policy formulation.
Practice MCQs
739 Students attempted
Key Highlights:
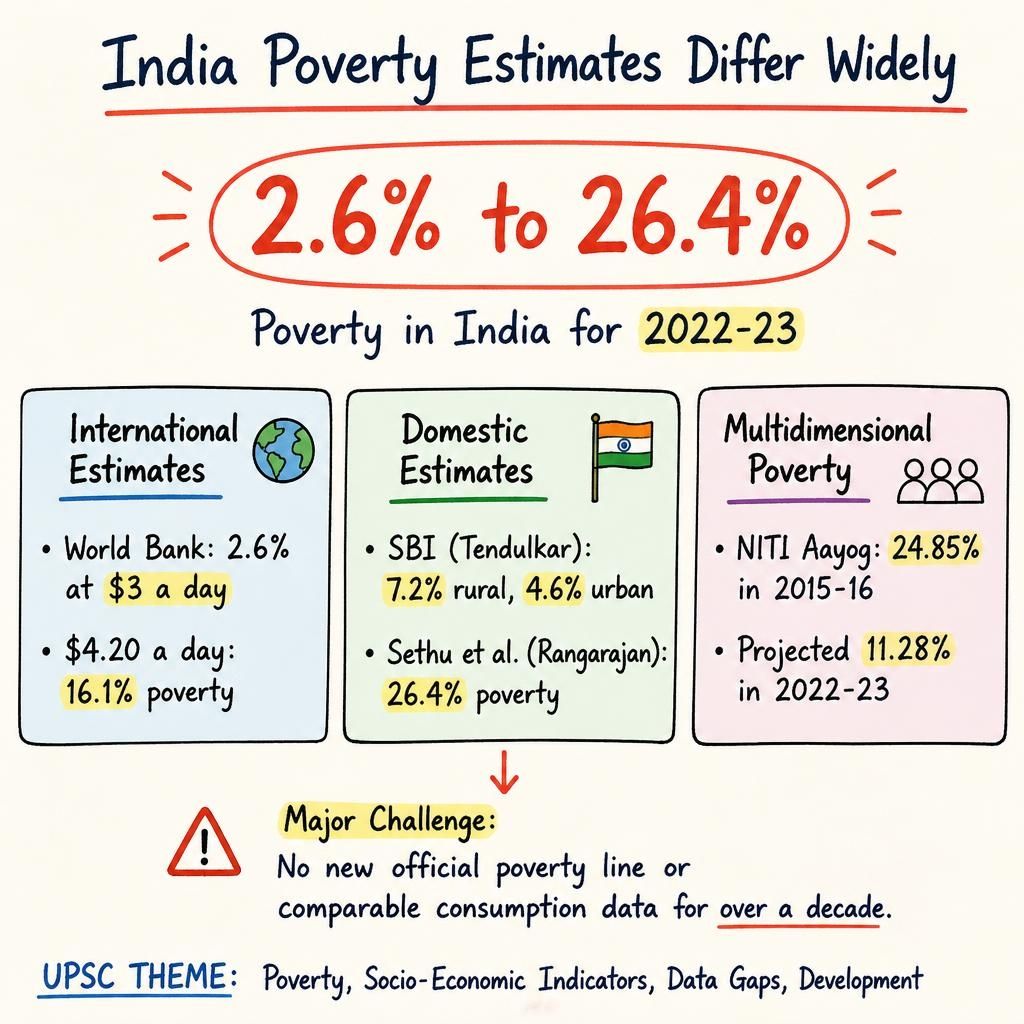
- Poverty estimates in India for 2022-23 show significant variation, ranging from 2.6% to over 26%, depending on the methodology and poverty line used.
- The World Bank reported 2.6% of Indians were poor in 2022-23 using its $3 a day (2021 PPP) international poverty line.
- When the World Bank line is raised to $4.20 a day, the poverty estimate for India jumps to 16.1% for the same year.
- Domestic estimates also differ; SBI Research (using the Tendulkar line) reported 7.2% rural and 4.6% urban poverty, while Sethu et al. (reconstructing the Rangarajan method) found 26.4%.
- NITI Aayog stated that multidimensional poverty in India decreased from 24.85% in 2015-16 to a projected 11.28% in 2022-23.
- A major challenge in assessing poverty is the absence of a new official poverty line and comparable consumption data for over a decade.
Poverty Estimates.jpg
Detailed Insights:
- The wide divergence in poverty figures is primarily due to different poverty lines (e.g., Tendulkar vs. Rangarajan) and varying methodologies for adjusting or reconstructing these lines.
- World Bank international poverty lines are designed for global comparison using PPP dollars, rather than reflecting the specific cost of basic needs in India.
- Historically, poverty measurement in India began with minimum calorie needs, a method established by the Alagh Task Force in 1979.
- The Lakdawala Committee further refined this approach by introducing State-specific poverty lines and price indices.
- The Tendulkar Committee (2009) marked a shift by moving away from direct calorie norms to a broader consumption basket that included spending on health and education.
- The Rangarajan Committee later proposed higher poverty lines than the Tendulkar Committee, leading to a higher poverty rate estimate for the same period.
- The non-publication of the 2017-18 consumption survey created a significant data gap, hindering official and consistent poverty assessments for more than ten years.
- Multidimensional poverty offers a comprehensive view by considering deprivations across health, education, and living standards, going beyond just consumption expenditure.
- Despite India's progress in poverty reduction, the lack of a credible and updated official poverty benchmark makes it difficult to accurately measure achievements and remaining challenges.
- World Bank data from 2023 indicates that 80% of Indians lived below the $8.3-a-day upper-middle-income line, suggesting significant inequality despite lower extreme poverty figures.
- Approximately 30% of the Indian population still lacks access to basic sanitation, highlighting persistent gaps in fundamental living standards.
Key Concepts Involved:
- Poverty Line: A monetary threshold below which individuals or households are considered to be living in poverty.
- Purchasing Power Parity (PPP): A theoretical exchange rate that allows for the comparison of the purchasing power of different currencies for the same goods and services.
- Multidimensional Poverty Index (MPI): A measure of poverty that identifies multiple deprivations at the household and individual level in health, education, and living standards.
- Consumption Survey: A household survey that collects data on expenditure patterns to understand living standards and estimate poverty levels.

SuperKalam is your personal mentor for UPSC preparation, guiding you at every step of the exam journey.
Download the App


STUDY RESOURCES
CONTACT US
ⓒ Snapstack Technologies Private Limited